⚡ In short
Why does 90% of the energy phytoplankton produce get lost before it ever reaches a whale? This article explains the "10% rule" and how ocean acidification and warming are throwing the timing of the marine food web out of sync.
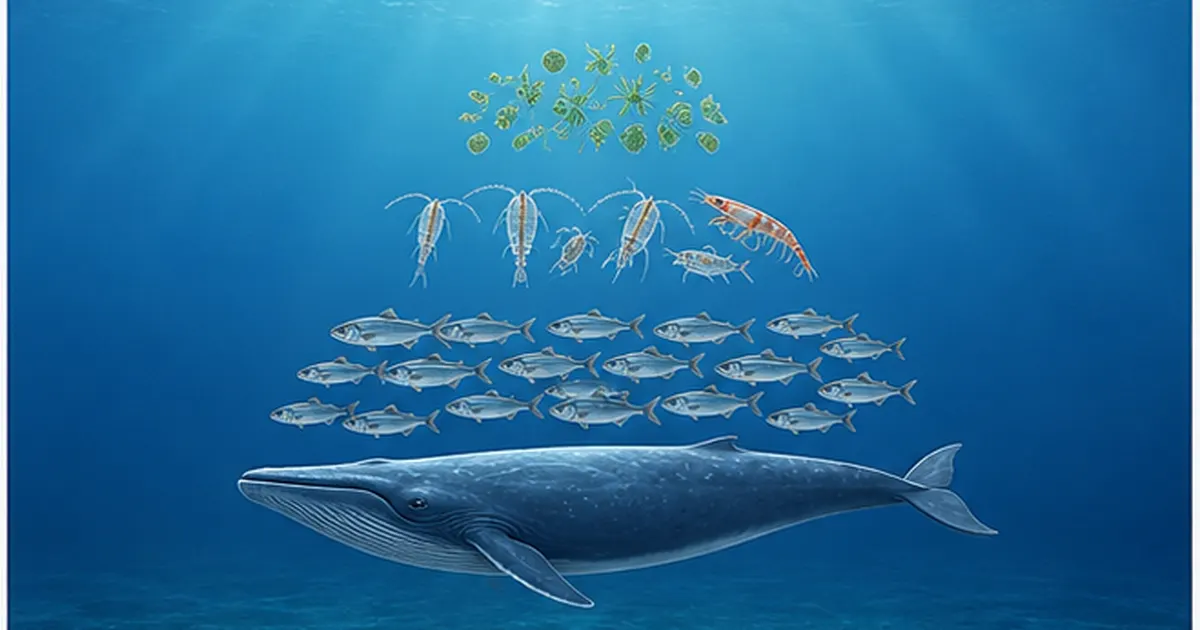
How can plankton, almost invisible to the naked eye, sustain the life of a blue whale over 30 meters long? The answer lies in the ocean food web's distinctive "pyramid structure."
Organic matter produced by phytoplankton through photosynthesis is passed step by step to zooplankton, small fish, large fish, and finally whales. But at each step, roughly 90% of the energy is lost as heat, and only about 10% is carried forward to the next level. This "10% rule" is the reason marine ecosystems narrow from bottom to top into a pyramid shape — and it is also the physical law explaining why so few organisms exist at the very top.
In recent years, two threats — ocean acidification and global warming — have begun to affect this finely tuned chain of energy. As plankton shells become more prone to dissolving and the timing of spring phytoplankton blooms shifts earlier, a "timing mismatch" with predators is starting to emerge. This article explains the basic structure of the ocean food web and how climate change is disrupting that chain, using the latest research data.
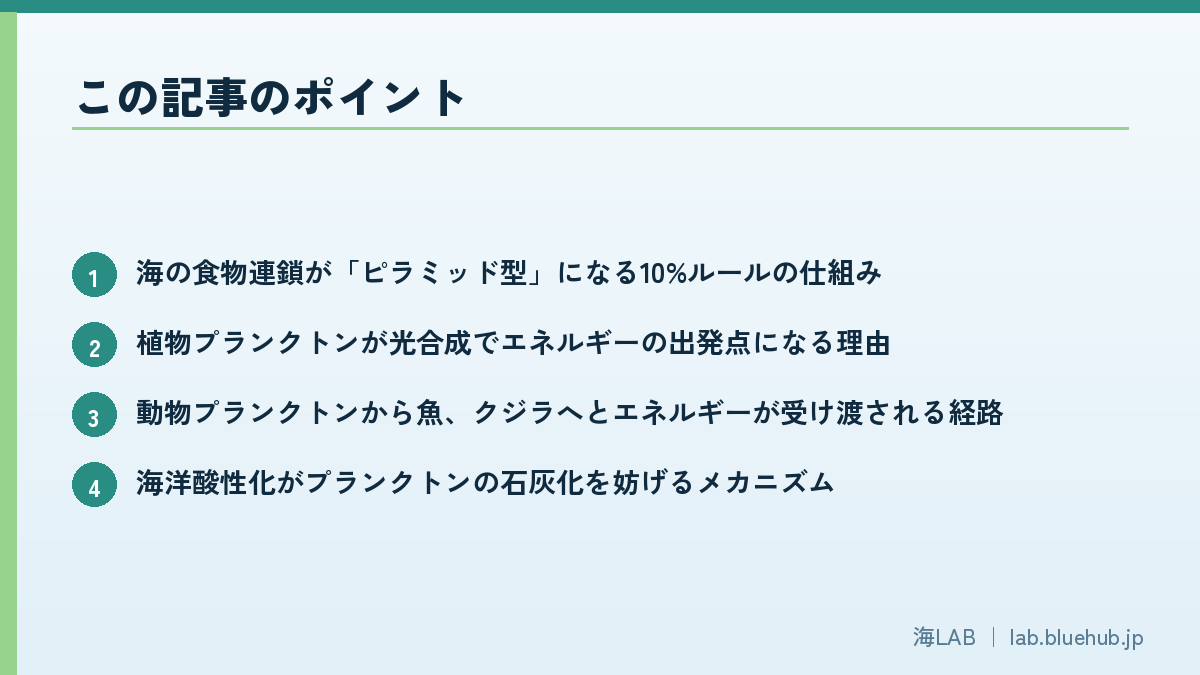
What you'll learn in this article
- How the "10% rule" makes the ocean food web pyramid-shaped
- Why phytoplankton are the starting point of energy through photosynthesis
- The path energy takes from zooplankton to fish to whales
- The mechanism by which ocean acidification hinders plankton calcification
- How warming-driven "seasonal mismatch" (match-mismatch) affects fisheries
What Is the Ocean Food Web? A Single Path from Producers to Apex Predators
A "food chain" refers to the linked structure of "eat and be eaten" relationships among organisms. In the ocean, the starting point is, with few exceptions, phytoplankton. Using sunlight, carbon dioxide, and dissolved nutrients (nitrogen and phosphorus) as raw materials, they perform photosynthesis and take on the role of "producer," being the first to generate energy in the form of organic matter.
Three Roles: Producers, Consumers, and Decomposers
Ecosystems run largely on three roles. "Producers" (phytoplankton and seaweed) create organic matter; "consumers" (zooplankton, fish, marine mammals) eat it to survive; and "decomposers" (bacteria and archaea) break down dead matter and waste back into nutrients. The nutrients decomposers create are used again by phytoplankton for photosynthesis, so matter circulates. Energy, however, flows one way only — from producers to consumers, and ultimately out of the system as heat released into the ocean.
Four Levels That Make Up the Ocean Food Web
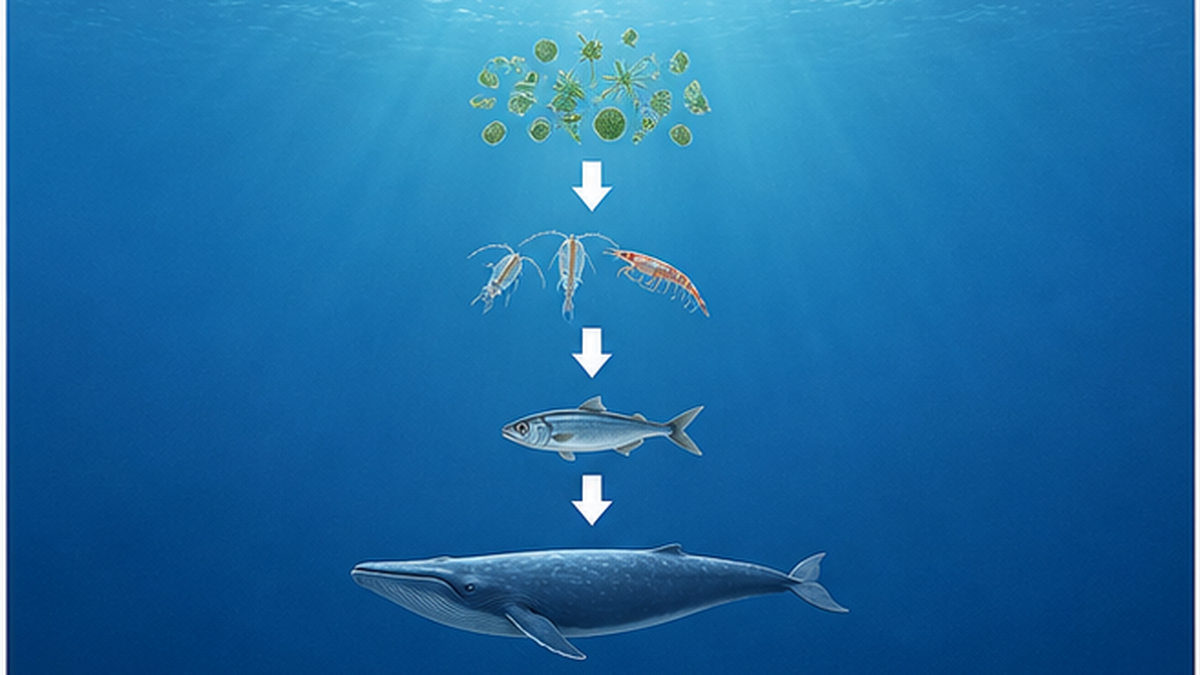
- Level 1 (Producers): Phytoplankton (diatoms, coccolithophores, dinoflagellates, etc.)
- Level 2 (Primary consumers): Zooplankton (copepods, krill, fish larvae)
- Level 3 (Secondary consumers): Small to mid-sized fish such as sardines and mackerel pike
- Level 4 (Higher consumers): Large predators such as tuna, sharks, seals, and baleen whales
The Difference Between a "Food Chain" and a "Food Web"
- In the real ocean, a single species eats multiple organisms and is eaten by multiple organisms, forming a net-like "food web" rather than a simple chain.
- Zooplankton, for example, eat not only phytoplankton but other zooplankton, and are eaten not only by small fish but also by whale larvae and seabird chicks.
The Food Web Decides Who Survives
Which organisms dominate a given sea area depends heavily on how this food web foundation is structured. Small pelagic fish such as sardines, for instance, are known to undergo decades-long boom-and-bust cycles ("regime shifts") in waters rich in zooplankton, and much of what triggers these swings lies in changes to the amount and timing of phytoplankton and zooplankton at the base of the food web. This is why understanding marine ecosystems requires attention not only to apex species but to changes at the foundation.
How It Differs from Food Chains on Land
On land, producers such as trees and grasses grow over decades or centuries, accumulating enormous stores of organic matter in their own bodies. Phytoplankton, the ocean's producers, live only days to a few weeks at most, sustaining the ecosystem by being constantly eaten and constantly regrowing. The ocean food web's characteristic of "small standing stock, enormous production" arises from this short lifespan of its producers. A scoop of seawater at any given moment may seem to contain only a small amount of phytoplankton, but the total production over a year rivals that of land ecosystems.
Why a Pyramid Shape? The Truth Behind the "10% Rule"
Draw the ocean food web as a diagram and it always forms a pyramid — wide at the bottom, narrow at the top. This is no coincidence; it is the inevitable result of a physical constraint in ecology known as "ecological efficiency."
Ninety Percent of Energy Disappears as Heat
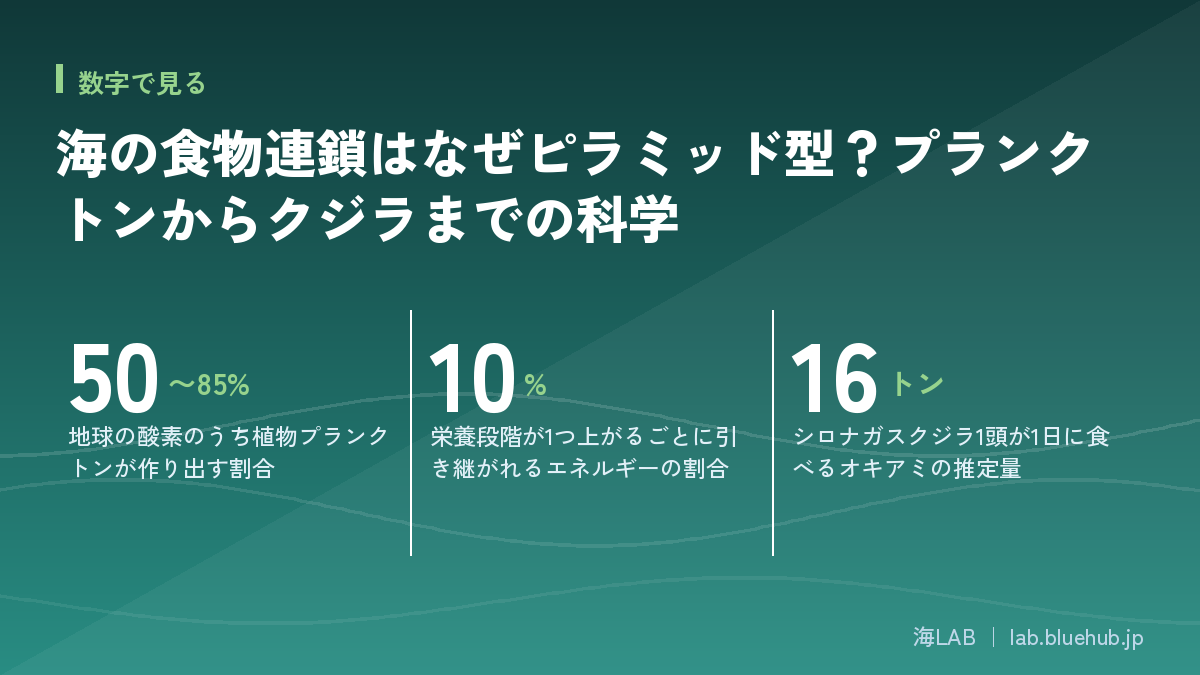
Of the food energy an organism obtains at a given trophic level, only about 10% is passed on intact when it is eaten by the next level. The remaining roughly 90% is lost as heat through life processes such as respiration, maintaining body temperature, digestion, and movement, or is excreted undigested. This rule of thumb, known as the "10% rule," is widely cited as a rough guideline that holds across ecosystems in general.
How Ecological Efficiency Shrinks Biomass
| Trophic level | Representative organisms | Relative biomass (illustrative) |
|---|---|---|
| Level 1 (Producers) | Phytoplankton | 100 |
| Level 2 (Primary consumers) | Zooplankton | 10 |
| Level 3 (Secondary consumers) | Small fish | 1 |
| Level 4 (Higher consumers) | Large fish / whales | 0.1 |
This is precisely why the number of apex predators in marine ecosystems is orders of magnitude smaller than the standing stock of phytoplankton. Put another way, sustaining the population of top predators such as whales or tuna requires tens or even hundreds of times as much phytoplankton and small fish to exist in the sea.
Cold-Blooded vs. Warm-Blooded Efficiency
Ecological efficiency also varies with an organism's physiology. Ectotherms (cold-blooded animals) such as fish and crustaceans spend relatively little energy maintaining a constant body temperature, so they can pass on energy to the next level with relatively higher efficiency. Endotherms (warm-blooded animals) such as whales, by contrast, expend a great deal of energy keeping their body temperature constant even in cold seawater, meaning they need more food per unit of body weight. The blue whale's extraordinary appetite is not unrelated to this cost of being warm-blooded.
The Origins of the "10% Rule"
The idea that energy shrinks at each successive trophic level traces back to the "trophic-dynamic concept" proposed in the 1940s by American ecologist Raymond Lindeman. Studying lake ecosystems, he quantitatively tracked the energy balance at each trophic level and showed that energy passed to higher levels diminishes substantially. This concept was later applied to marine ecosystems as well, becoming widely known as the accessible "10% rule." In practice, however, actual efficiency ranges from a few percent to as much as 20% depending on the ecosystem and species, and 10% should be understood only as a representative benchmark.
Phytoplankton: The Starting Line of the Ocean Food Web
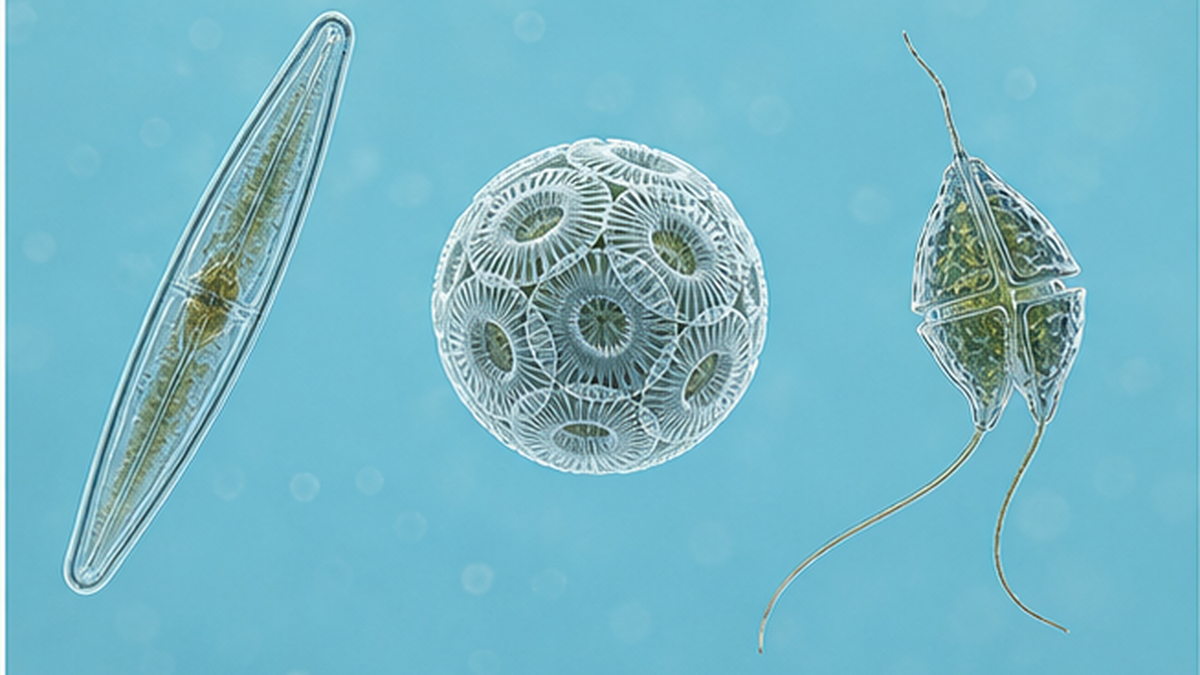
The ocean's producers include a diverse array of phytoplankton: diatoms with glassy (silica) shells, coccolithophores covered in calcium carbonate discs, and dinoflagellates that swim using flagella. All are too small to see with the naked eye, yet their numbers are vast, forming a thin "green soup" across the ocean's surface layer.
Producing More Than Half of Earth's Oxygen
Although the standing stock of phytoplankton is far smaller than that of forests on land, their extremely rapid turnover means they are estimated to account for roughly half of the planet's total primary production (organic matter produced through photosynthesis). Oxygen released as a byproduct of photosynthesis is estimated to make up roughly 50–85% of atmospheric oxygen, earning the ocean its nickname as "Earth's lungs." For more on this oxygen-supply mechanism, see the related article How Phytoplankton Produce Half of Earth's Oxygen.
Nutrients and Light That Determine Primary Production
- Photosynthesis requires the "euphotic zone," roughly the top 200 meters where sunlight can reach
- Without sufficient nutrients such as nitrogen, phosphorus, and iron, growth cannot occur even with adequate light
- Nutrient inflow from rivers, and "upwelling" that brings deep water to the surface, create productive fishing grounds
How Much Organic Matter Is Produced Across the Whole Ocean
Researchers estimate that the ocean's total annual net primary production amounts to roughly 48 billion tonnes of carbon — a scale comparable to the photosynthetic production of forests and grasslands on land. Despite phytoplankton's far smaller standing stock compared to land plants, this level of production is achieved through an extremely fast turnover, regrowing on a cycle of days to weeks. Satellite observation of chlorophyll-a concentration (ocean color remote sensing) has become a key tool for tracking the distribution and seasonal changes of phytoplankton from space.
Two Faces of Phytoplankton
- As "producers," they serve as the starting point of the food web, providing the energy source for zooplankton and fish
- As drivers of the "biological pump," they absorb CO2 through photosynthesis and lock carbon away on the seafloor as their remains sink into the deep ocean
Zooplankton: The Bridge Between Producers and Predators
Zooplankton are the first to receive the organic matter produced by phytoplankton. The leading groups are the crustacean "copepods," resembling tiny water fleas, and "krill," resembling small shrimp — together making up much of the ocean's zooplankton biomass.
Copepods and Krill: Ecosystems Sustained by Sheer Numbers
Copepods are only a few millimeters long, but their populations across the ocean are enormous, and they are an essential food source for the larvae and juveniles of many fish species. Antarctic krill, meanwhile, living in the Southern Ocean, grow to about 5 cm and form massive swarms, with an estimated total biomass reaching hundreds of millions of tonnes — sustaining virtually the entire Antarctic ecosystem, from baleen whales to seals to penguins. For more detail on the food web sustained by Antarctic krill, see Why Antarctic Krill Sustain the Southern Ocean.
The Nightly Repeat of "Diel Vertical Migration"
Many zooplankton spend the day hiding in deeper waters to avoid predators, then rise toward the surface at night to feed on phytoplankton — a behavior known as "diel vertical migration." Considered one of the largest migrations of living organisms occurring anywhere on Earth every single day, it also plays a major role in the ocean's carbon cycle.
Two Roles Zooplankton Play
- Converting phytoplankton's organic matter into a form the next level can consume (bodies, eggs, fecal pellets)
- Contributing to the "biological pump" by carrying surface carbon to the deep sea through nightly vertical migration
North Atlantic Copepods and the Fragility of the Food Web
Calanus finmarchicus, a copepod species widespread in the North Atlantic, is an essential food source for the larvae of many commercially important species, including cod. Because this species prefers a specific temperature range, its distribution is reported to be shifting northward as sea temperatures rise, and researchers are debating whether reduced copepod availability in some regions could affect the fish stocks that depend on them. It is an example of how a shift in the distribution of a single zooplankton species can shake an entire regional food web.
Fecal Pellets: Another Pathway for Matter
Zooplankton do not convert everything they eat into energy. What they cannot digest is excreted as small "fecal pellets," which sink and become one of the pathways carrying carbon fixed at the surface down into the deep sea. Together with the active carbon transport of diel vertical migration, zooplankton are not only carriers of the food web but also supporters of the "biological pump" that lets the ocean continue absorbing atmospheric CO2.
From Fish to Whales: The Final Destination of the Energy Journey
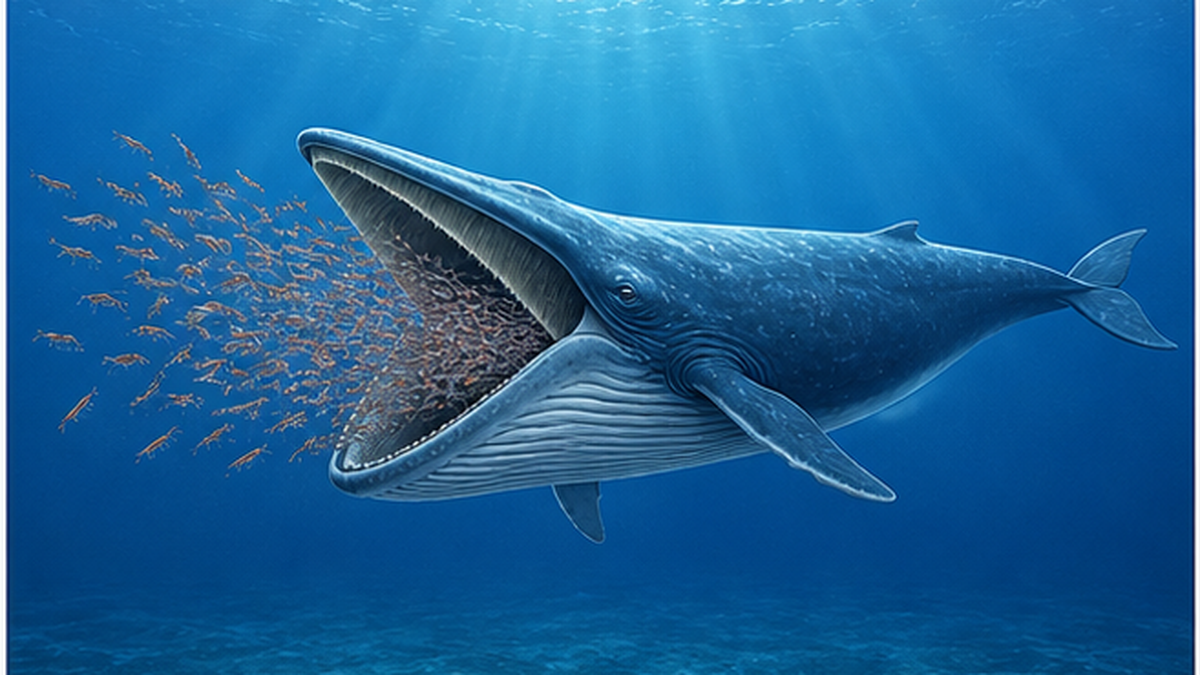
Zooplankton are eaten not only by small fish such as sardines and herring. Many baleen whales use "baleen plates" in place of teeth, gulping down huge amounts of seawater along with zooplankton and small fish and filtering it out — a strategy called "filter feeding" that lets them draw nutrition directly from plankton.
The Blue Whale's Astonishing Appetite
The blue whale, the largest animal on Earth, was once thought to eat roughly 4–8 tonnes of krill per day. But a study published in 2021 found actual intake to be about three times higher, averaging 16 tonnes per day — a result that substantially revised earlier scientific estimates. A single "gulp" can take in several tonnes of seawater and krill combined, underscoring the astonishing volume of zooplankton needed to sustain such a massive body.
A Vast Base Supporting Few Apex Predators
Under the 10% rule, sustaining the body of a single whale requires tens of times as much fish and krill, and tens of times more phytoplankton still. The fact that apex predators are "elite few in number" is simply the flip side of how vast the pyramid's base must be.
Filter Feeding Isn't Unique to Whales
Humpback whales, fin whales, right whales, and many other baleen whales practice similar filter feeding. Meanwhile, piscivorous apex predators such as tuna and bonito occupy another step in the food web, preying on the small and mid-sized fish that themselves eat zooplankton directly. Even among "apex predators," there is a whale-type path that draws energy directly from zooplankton and a tuna-type path that draws it indirectly through fish — with the latter experiencing greater energy loss along the way.
The Idea That "a Shorter Food Chain Is More Efficient"
The path by which baleen whales eat zooplankton directly is a "short food chain" with fewer trophic steps. Under the 10% rule, skipping a step means avoiding one round of energy loss, so shorter paths can sustain a large body more efficiently. The evolutionary advantage of "skipping intermediate steps to eat plankton directly" is thought to be part of why baleen whales became some of the largest animals on Earth today.
Migration: Another Survival Strategy
To efficiently locate swarms of krill and copepods across the vast ocean, many baleen whales undertake seasonal migrations spanning thousands of kilometers. A common pattern sees whales feeding intensively in food-rich high-latitude waters during summer to build up energy reserves, then moving to warmer, low-latitude waters in winter to breed. This long-distance migratory behavior is one evolutionary answer to the challenge apex predators face in efficiently securing limited food. For more on the mechanics of this migration, see Why Do Whales Migrate Thousands of Kilometers?.
Ocean Acidification: The Pyramid's Foundation Is Shaking
Some of the carbon dioxide released by human activity is absorbed by the ocean, gradually altering seawater chemistry. This is "ocean acidification." Some of the phytoplankton that support the pyramid's foundation are already being directly affected by this change.
Coccolithophores and Foraminifera: A Blow to Calcifying Organisms
Coccolithophores, a type of phytoplankton, cover their cells with disc-shaped plates of calcium carbonate called coccoliths. Foraminifera, single-celled organisms that drift through the ocean, also have calcium carbonate shells. As ocean acidification progresses, the saturation state of calcium carbonate in seawater declines, making it harder for these organisms to build shells or causing existing shells to dissolve more easily. Because coccolithophores are an important group supporting the ocean's primary production, their decline could affect the entire food web.
The Ongoing Shift in pH
According to the IPCC's Sixth Assessment Report, surface waters of the open ocean are seeing pH decline at a pace of roughly 0.0017 to 0.0027 per year. The number may look small, but on a geological timescale it represents an extremely rapid change, imposing a non-negligible burden on organisms with calcium carbonate shells.
Acidification's Effects Spread Gradually
- Beyond coccolithophores and foraminifera, organisms with calcium carbonate shells or skeletons in general — shellfish, corals, crustaceans — can be affected
- Because organisms at the base of the food web are numerous and less conspicuous, changes can take time to show up in fisheries resources
Acidification Monitoring Is Underway in Japanese Waters Too
Ocean acidification is not confined to the open ocean. Japan's Meteorological Agency conducts long-term monitoring of seawater pH and aragonite saturation at multiple fixed points, including in coastal Japanese waters, and a gradual pH decline has been confirmed on both the Pacific and Sea of Japan sides. Research from JAMSTEC has also detected signs of acidification in coastal waters such as the Tsugaru Strait, where the Sea of Japan and Pacific waters meet — showing that acidification is no longer a problem confined to the distant open ocean. Continued accumulation of such monitoring data is essential for assessing its effects on the plankton-based food web.
The Effect on Photosynthesis Itself Is Not Uniform
Research indicates ocean acidification can affect not only plankton "shells" but the mechanics of photosynthesis itself. In coccolithophores, for example, changes in seawater CO2 concentration are known to affect both calcification and photosynthesis, and the outcome — positive or negative — can be complex depending on species and conditions. Rather than simplifying acidification's effect as "all phytoplankton decline uniformly," researchers in this field emphasize the need to evaluate species-specific responses.
Warming and Acidification as a Combined Stressor
In the real ocean, acidification and rising temperature progress simultaneously, driven by the same cause — increasing atmospheric CO2. As temperatures rise, seawater holds less dissolved oxygen, straining plankton respiration and metabolism, while acidification hinders shell formation. This combination of stressors acting together may have a greater impact on organisms than results from experiments examining a single factor in isolation, and recent ocean research increasingly seeks to evaluate the two together rather than separately.
The "Timing Mismatch" Caused by Warming: The Match-Mismatch Hypothesis
For a food web to function properly, timing matters as much as quantity. This is the perspective behind the "match-mismatch hypothesis," proposed in the 1960s by British fisheries scientist David Cushing.
Spring Blooms and the Timing of Fish Spawning
In spring, rising temperatures and longer daylight trigger an explosive increase in phytoplankton known as the "spring bloom." Many fish have evolved to spawn in sync with the resulting increase in the zooplankton that eat this phytoplankton, so that hatched larvae find abundant food. When this "match" is achieved, larval survival rates are higher.
The "Mismatch" Created by Warming
But when climate change accelerates the pace of warming, phytoplankton blooms can occur earlier than before, while zooplankton growth and fish spawning fail to advance at the same rate, creating a "mismatch." Because different trophic levels respond to warming at different speeds, previously synchronized timing can break down, risking a "trophic mismatch" in which larvae hatch too late to find food and survival rates fall.
- Phytoplankton blooms occur earlier than usual, or their scale shrinks
- Zooplankton development fails to keep pace, so larvae hatch after the food peak has passed
- As a result, survival of juvenile fish in a given year can drop sharply, affecting catch volumes years later
The Mismatch Observed in North Sea Cod
What led Cushing to formulate his hypothesis was the large year-to-year variation in fish recruitment (the amount of juvenile fish born in a given year that join the harvestable stock) in the North Sea. Years when the peak of zooplankton abundance coincided well with fish hatching showed high recruitment, while years with a mismatch showed sharply lower recruitment — a finding that became a landmark study demonstrating the importance of timing in marine ecosystems and has strongly influenced subsequent research on climate change and fisheries resources.
How a Disrupted Food Web Affects Fisheries and Our Lives
Changes in the ocean food web do not stay confined to the sea. They connect directly to our dinner tables and the livelihoods of coastal communities.
Impact on Fisheries Resources
Rising water temperatures change not only the distribution of fish but also the patterns of zooplankton abundance that fish depend on for food. As a result, catches at fishing grounds that were once reliable can decline, while new species may begin appearing in waters where they were not previously caught — bringing geographic and seasonal shifts to the fishing industry.
Ripple Effects on Coastal Ecosystem Services
The food web built on plankton sustains not only fish but a wide range of organisms, including seabirds, seals, and whales. Small changes at the base of the food web are not uncommonly followed years later by changes in the population of predators higher up. Understanding this "time-lagged chain reaction" within marine ecosystems is important for fisheries resource management and the design of marine protected areas.
The Rise of Jellyfish: Another Scenario
In waters where warming or eutrophication has altered conditions, cases of jellyfish increasing while fish decline have been reported worldwide. Jellyfish also eat zooplankton, but they are considered less efficient carriers of the food web than fish, so ecosystems dominated by jellyfish tend to leave a smaller share of usable energy for fisheries. Whether fish or jellyfish dominate the consumption of zooplankton makes a substantial difference in how much of the ocean's productivity we can actually make use of.
What We Can Do
- Consider choosing seafood from responsibly managed fisheries (such as those with MSC certification)
- Take energy-saving actions that help reduce the CO2 emissions driving ocean acidification and warming
- Stay informed about ongoing research and observational data on plankton and marine ecosystems
Shifts in Distribution and Fishing Seasons Reported in Japan Too
Japanese fisheries industry organizations have also pointed out cases across the country where rising sea temperatures have made catches at traditional fishing grounds unstable or shifted the timing of fishing seasons. Behind such changes, alongside the direct effects of water temperature, is the possibility that shifts in the timing and distribution of zooplankton play a role. Changes to plankton, the foundation of the food web, can affect the types and prices of fish on our tables over a lag of several years to decades.
Conclusion: A Vast Ocean Sustained by Tiny Plankton
From phytoplankton too small to see with the naked eye to the blue whale, the largest animal on Earth — the ocean food web is an intricate pyramid structure that passes on energy under the physical constraint of the "10% rule."
This pyramid has been built over tens of millions of years of evolution, as the mechanism of production through photosynthesis meshed with the mechanisms of the diverse consumers that rely on it. But ocean acidification and global warming, driven by human activity, are shaking this balance at a pace that is, in evolutionary terms, virtually instantaneous — occurring over mere centuries or decades. Research continues around the world to monitor changes in these small organisms and use them to gauge the health of the ocean as a whole.
The next time you stand at the shore, remember that the clear seawater in front of you is teeming with countless phytoplankton and zooplankton. That accumulation, drop by drop, is what sustains the lives of whales and tuna migrating far offshore — and the fish on our own dinner tables — at this very moment.
- The ocean food web follows the 10% rule, forming a pyramid in which biomass shrinks at higher levels
- Phytoplankton are the starting point of primary production, producing 50–85% of Earth's oxygen
- Zooplankton serve as the bridge that carries energy from fish to whales
- Ocean acidification hinders plankton calcification and can destabilize the pyramid's foundation
- The timing mismatch caused by warming (match-mismatch) can affect fisheries resources
Understanding just how intricate this pyramid is — and how vulnerable it is to climate change — is a first step toward living alongside the ocean.
Key Takeaways
- The ocean food web forms a pyramid due to an energy transfer efficiency of about 10% per level
- Energy is passed on through the sequence phytoplankton → zooplankton → fish → whales
- Acidification and warming are two climate-driven risks threatening both the pyramid's foundation and its timing
References and Sources
- Japan Meteorological Agency – Knowledge of Ocean Acidification / Effects of Ocean Acidification
- JAMSTEC (Japan Agency for Marine-Earth Science and Technology) – Release of the IPCC Sixth Assessment Report (Working Group I)
- JAMSTEC BASE – Is Ocean Acidification Happening in Japanese Waters Too? Changes in the Tsugaru Strait
- Japan Institute of Maritime Enlightenment – Oxygen Is Also Made by the Ocean
- National Institute for Environmental Studies, Japan – How Much Photosynthesis Do Plants on Earth Perform? A Meta-Analysis of Net Primary Production
- Nature Ecology & Evolution – Tritrophic phenological match–mismatch in space and time
- Nikkei – Whales Turn Out to Be Bigger Eaters Than Thought: Three Times the Estimate, 16 Tonnes a Day
- Hokkaido University – Plankton Sustaining Marine Ecosystems and the Impact of Climate Change
- Japan Fisheries Association, Fish Education and Promotion Center – The Impact of Global Warming on Marine Products and Seafood
* Listed in order of reliability: government and academic institutions > peer-reviewed papers > specialist organizations > reputable media