⚡ The answer in 30 seconds
- The AMOC is likely to weaken with warming, but the timing and probability of an abrupt collapse vary widely between studies.
- About 20 years of RAPID data show a weakening trend, but the error margin is large and more time is needed to separate it from natural variability.
- Check the premises and ranges behind any probability figure, and read it against several sources.
News keeps appearing that the Atlantic's great current system, the AMOC, is weakening and could, in the worst case, collapse abruptly. But "when" and "with what probability" differ greatly from study to study.
This article sorts out what three approaches—observation, climate models and statistical estimation—each tell us and where their limits lie, using published figures as a guide.
Please read it as a map for separating what is certain from what is uncertain, without rushing to a conclusion.
What you will learn
- The difference between slowdown and collapse
- What RAPID observations do and do not tell us
- Why collapse-timing estimates differ between studies
- How confident we are about the expected impacts
- How to read probability figures correctly
What is the AMOC slowdown risk? First, sorting out what exactly is of concern
The basics of the Atlantic's great circulation
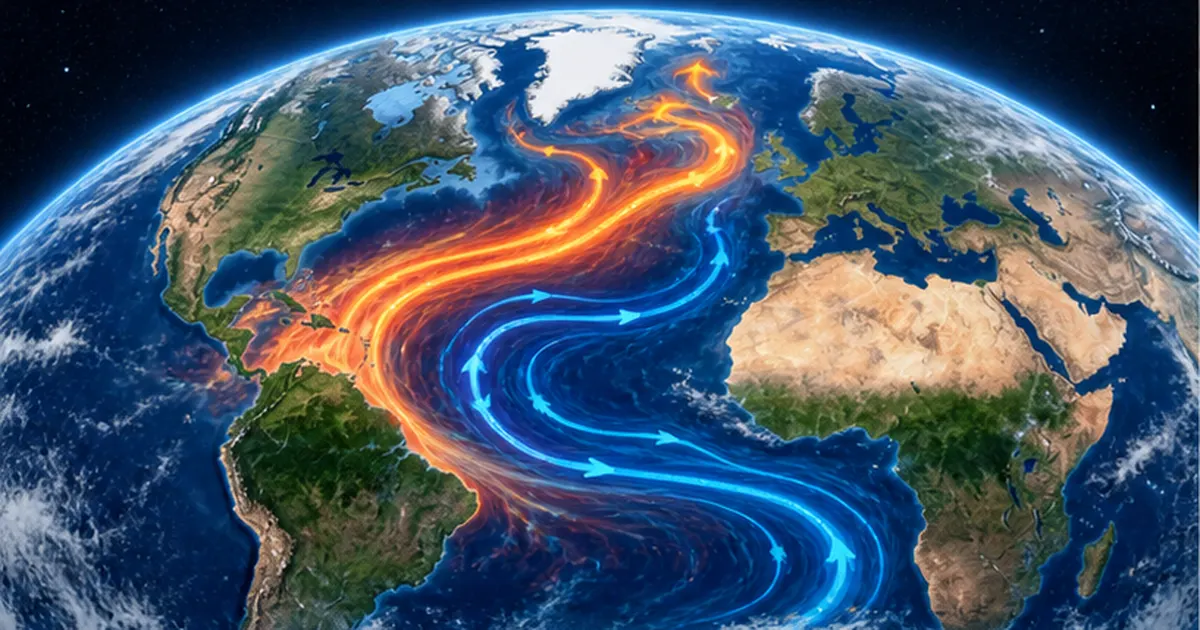
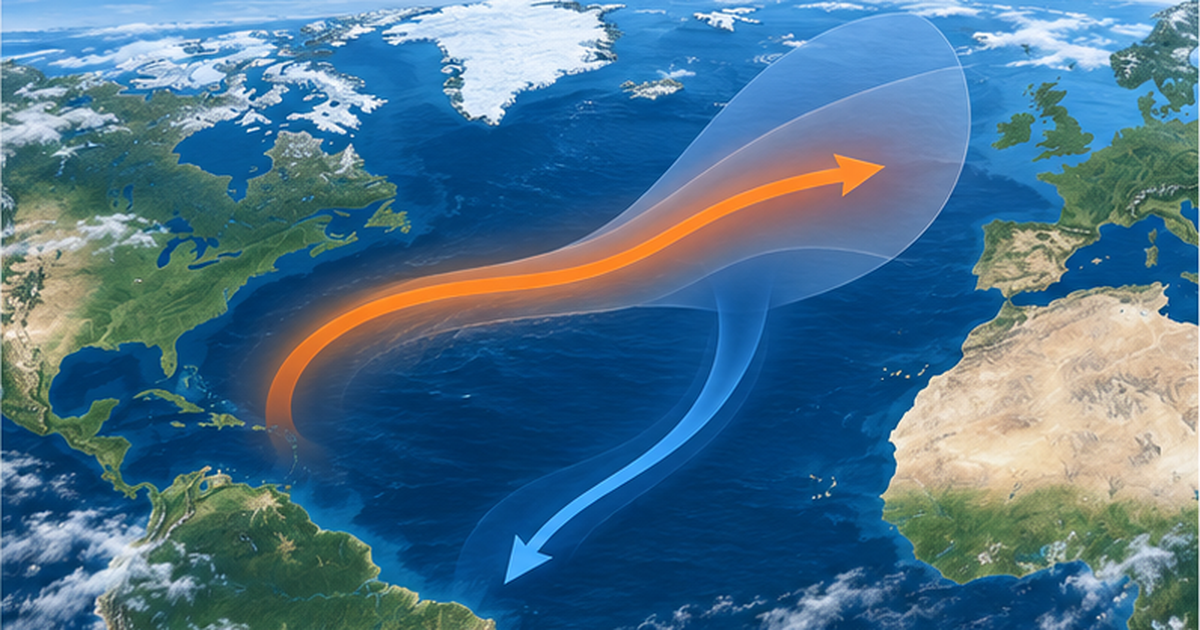
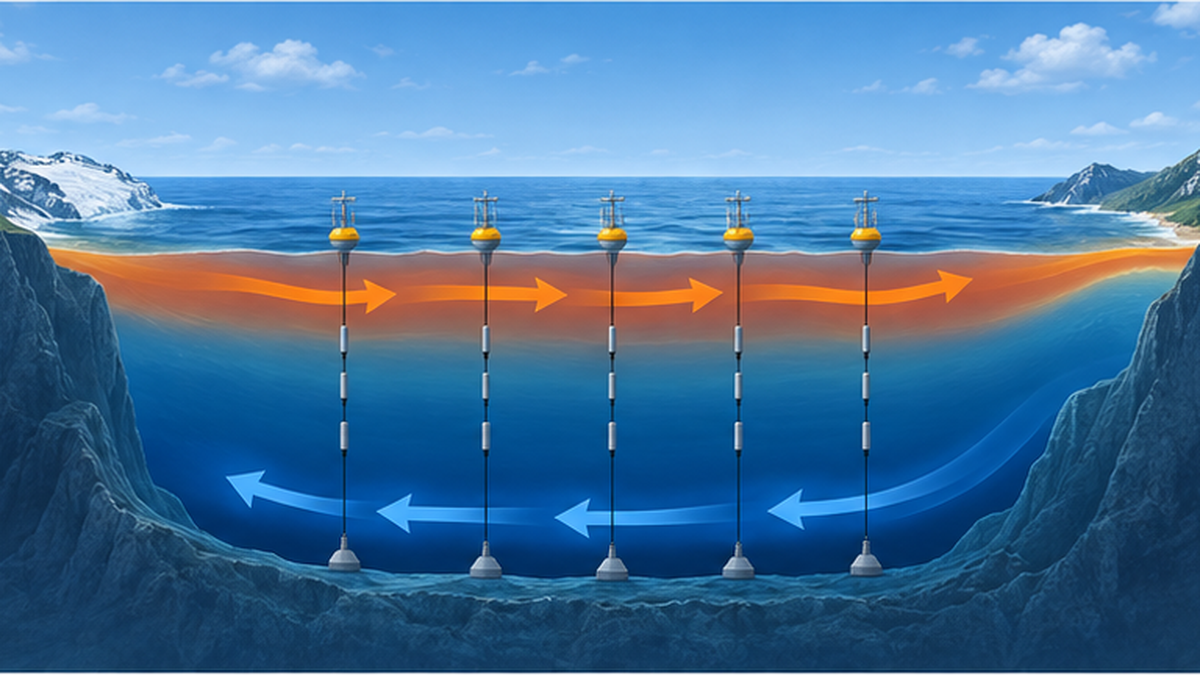
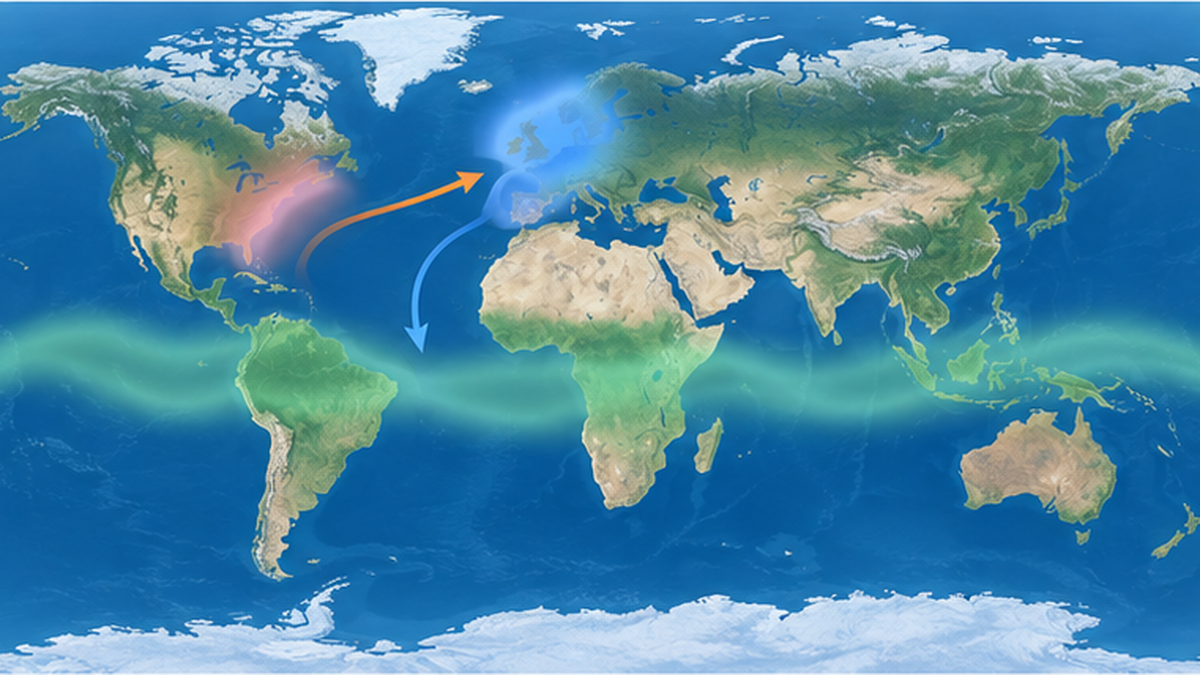
The AMOC (Atlantic Meridional Overturning Circulation) is a huge circulation of seawater running north–south through the Atlantic. Warm, salty surface water flows north from the tropics and carries heat to the seas off northern Europe as the Gulf Stream and North Atlantic Current. Water cooled at high latitudes becomes denser, sinks, and returns south at depth. This combination of a northward surface flow and a southward deep return plays a major role in distributing heat and carbon around the globe.
The strength of the circulation is measured in sverdrups (Sv). One Sv is a flow of one million cubic meters of seawater per second, and the AMOC at around 26°N is on the order of a dozen or so Sv. Rather than the absolute value, research focuses on how much it changes year to year and whether the change is natural variability or an effect of warming.
Two scenarios of concern
It helps to think of concerns about the AMOC in two stages.
- Gradual slowdown: as warming heats the North Atlantic surface and Greenland ice-sheet meltwater dilutes salinity, water sinks less readily and the circulation weakens gradually. Many climate models project a slowdown during the 21st century.
- Abrupt collapse (tipping): once a threshold is crossed, the circulation shifts to a weak state all at once and is hard to reverse. Researchers disagree on whether and when this could happen.
This article does not explain how the AMOC works; it focuses on "how certain is the risk?" and "why do estimates differ so much between studies?" For the mechanism and an overview of observations, see our sister articles AMOC research frontier and Why the thermohaline circulation is weakening.
Key points of this section
- The AMOC is the north–south Atlantic circulation that carries heat and carbon
- The key is to separate "gradual slowdown" from "abrupt collapse"
- This article's theme is how to read probability and its uncertainty
What observations tell us: what over 20 years of the RAPID array show
What is the RAPID array?
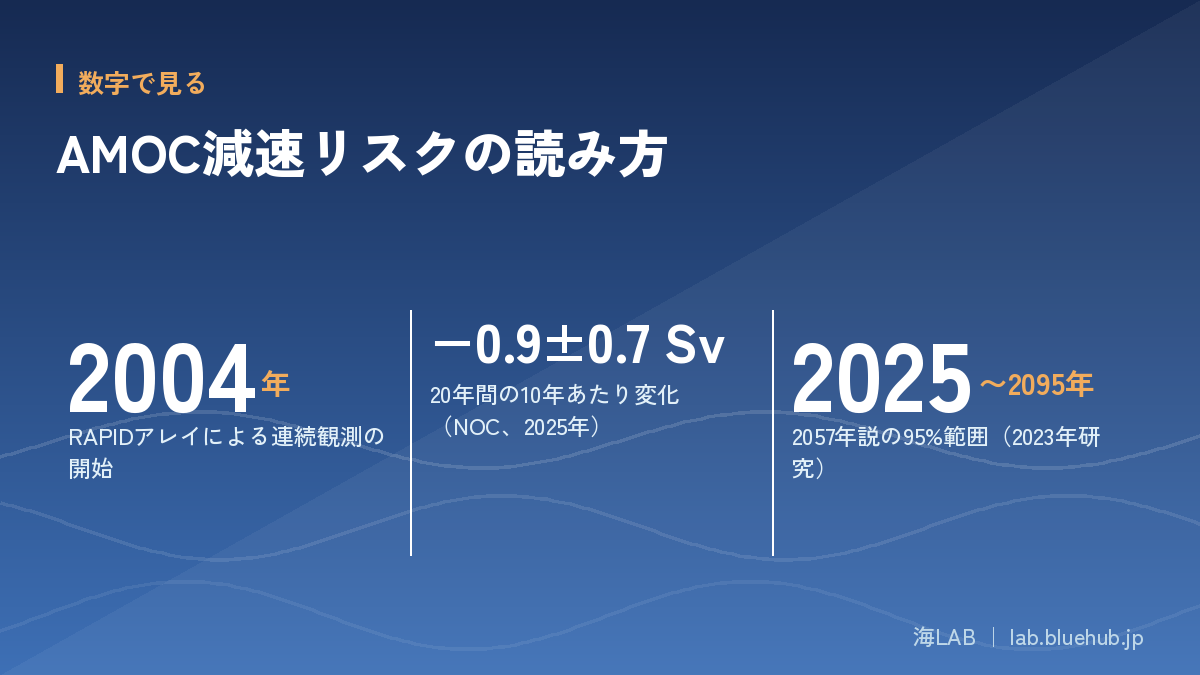
The main way of measuring the AMOC directly is the RAPID array deployed around 26°N. Since 2004, moored sensors on the seabed have continuously recorded temperature, salinity and currents, and the flow across the Atlantic is summed to estimate the strength of the circulation. Similar mooring observations are spreading to other latitudes, but RAPID is the leading example with a continuous record of over 20 years.
A slowing trend is visible, but the margin is wide
A summary of 20 years of data published in September 2025 by the UK's National Oceanography Centre (NOC) reports a change in the AMOC over the observation period of about −0.9±0.7 Sv per decade. Because the error margin is close to the size of the mean, it is reasonable to read this as "a decreasing tendency, but with limited confidence." A 2025 paper by McCarthy and colleagues analysing the same RAPID record gives a decline of 1.0 Sv per decade (0.4–1.6 Sv) for 2004–2023.
Importantly, the paper states that the current trend is consistent with climate-model projections and does not indicate a collapse in the mid-21st century. From signal-to-noise ratios, it estimates that the present change would reach an "unfamiliar" level in the 2040s and an "unknown" level in the 2060s. In short, observations alone will need more time before a firm conclusion is possible.
Limits of observation
- The record is about 20 years, too short to separate multi-decadal natural variability
- The RAPID team says observations must continue at least until 2034 to tell natural variability from human influence
Seeing the slowdown as a "recovery"
An analysis by UK Met Office researchers published in Nature Geoscience showed that the recent slowdown may be part of decadal variability following a strengthening from the mid-1990s. At the same time, it also states that a weakening of the AMOC through the 21st century due to rising greenhouse gases is "very likely." "Short-term fluctuation" and "long-term trend" are different things.
Why probability estimates differ: IPCC versus individual studies
The position of the IPCC Sixth Assessment Report
The IPCC Sixth Assessment Report (AR6) assessed an AMOC collapse within the 21st century as "very unlikely" with medium confidence. On the other hand, a weakening of the AMOC through the 21st century is "very likely," with high confidence. Note that "very unlikely" is not "zero," and the confidence is "medium," not "high."
Studies that estimated the collapse time statistically
A 2023 study by Ditlevsen and Ditlevsen in Nature Communications found statistical properties of a tipping precursor in an index built from sea surface temperature records and estimated the central timing of collapse at 2057 (2025–2095 within a 95% range). Note how wide that range is. Critical analyses have also appeared arguing that the result changes greatly depending on the choice of model.
A 2024 study by Smolders, van Westen, Dijkstra and colleagues at Utrecht University in the Netherlands estimated the collapse time from reanalysis data at 2037–2064 (10–90% range), averaging 2050, and the probability of collapse before 2050 at about 59±17%. However, this is an estimate under a specific simplified model framework and assumptions, and does not necessarily apply directly to the real ocean.
| Source | Main conclusion | Caveat |
|---|---|---|
| IPCC AR6 (2021–23) | Collapse within the 21st century is very unlikely (medium confidence) | Does not reflect research after the assessment cut-off |
| Ditlevsen & Ditlevsen (2023) | Central estimate of collapse: 2057 (2025–2095) | Criticized because the result depends on the choice of statistical model |
| Smolders et al. (2024) | Collapse time 2037–2064; probability before 2050 about 59% | Estimate based on a simplified model, not the real-world probability |
| McCarthy et al. (2025) | Observed trend is consistent with models and does not indicate a mid-21st-century collapse | Observations span only about 20 years |
The main reason estimates differ is differences in what material was used and what assumptions were made. Three different methods—observation, climate models and detection of statistical precursors—each have their own limits.
Limits of climate models: where is the threshold?
What models struggle with: how freshwater enters
What governs the strength of the AMOC is the "weight" of North Atlantic surface water. The colder and saltier seawater is, the denser it is and the more easily it sinks. When warming heats the surface and meltwater from the Greenland ice sheet and increased precipitation dilute salinity, sinking weakens. However, many climate models cannot yet represent in enough detail where and how much meltwater flows in.
The boundary between "stable" and "unstable" is not a single line
In a 2024 study, van Westen and colleagues ran experiments adding freshwater gradually to look for the critical point at which the AMOC switches to a weak state. They argue that under a high-emissions scenario the threshold is likely to be crossed within the 21st century. However, this kind of study depends on a small number of models, and other models may give different results. The discussion among researchers is ongoing.
Accepting that "different models give different answers"
- The location of the threshold differs greatly between models
- Which model is closer to reality cannot be settled because observations are short
- "Probability" figures depend strongly on the choice of model
The difficulty of early warning signals
As a system nears a threshold, statistical precursors such as larger fluctuations and slower recovery to the original state are thought to appear. Attempts to detect such "early warning signals" from real observations are active, but because the data used are indirect indicators such as sea surface temperature, interpretations differ. Model-based tests have also reported cases where conventional early warning signals do not necessarily sound an alarm.
So both "precursors were found, so it is dangerous" and "none were found, so it is safe" are premature. When discussing risk, it is necessary to understand that failing to detect something is not the same as its absence.
If it weakened abruptly: expected impacts and how certain they are
Impacts on the climate of northwestern Europe
If the AMOC weakened substantially, heat transport in the North Atlantic would decrease, and temperatures in northwestern Europe in particular are thought to fall, or warming to slow. However, because global temperature continues to rise with greenhouse gases, in many cases this would take the form of "regional cooling on top of warming."
Ripple effects on sea level, rainfall and ecosystems
- Sea-level rise along the North Atlantic coast: a weaker circulation has been pointed out to raise sea level locally, for example along the U.S. East Coast.
- Shifts in the tropical rain belt: the intertropical convergence zone could shift south and affect monsoon and rainfall patterns in Africa and Asia.
- Marine ecosystems: changes in nutrient supply and phytoplankton distribution could spill over to fishery resources.
- Carbon uptake: weaker sinking to the deep could reduce the ocean's ability to absorb atmospheric CO₂.
These are impact assessments based on the assumption of a "substantial weakening"; the direction of impacts is relatively consistent, while their scale and timing are uncertain. Impacts on Japan are also likely to be mainly indirect, via the global climate, food and logistics. See also sea-level rise along Japan's coast for Japan's sea level, and record ocean heat content for ocean heat accumulation.
A guide to certainty
- Direction of impacts: relatively consistent
- Scale and timing of impacts: vary greatly between studies
- Impacts on Japan: indirect, with few assessments
How to read risk: separate probability, timing and impact
Probability figures are "conditional"
Figures such as "59% by 2050" or "around 2057" easily travel alone as headlines, but they always come with premises: which model, which scenario, which data. If the premises change, so does the conclusion. When you see a number, always check the "95% range" or "10–90% range" beside it.
Separate the time axis
| Time frame | What could happen | Certainty |
|---|---|---|
| Now to the 2030s | Decadal fluctuations; a period of accumulating observations | A slowing trend is visible but hard to separate from natural variability |
| 2040s–2060s | The observed signal may clearly exceed natural variability | Depends on continued observation |
| Late 21st century | Substantial weakening under high emissions; possible threshold crossing | Strongly depends on model and scenario |
Why low probability still cannot be ignored: the size of impact
Risk is thought of as "probability × impact." Even if the probability of collapse is low, if the impact is broad and irreversible, the value of preparing is high. This is common to tipping elements in general, and the important point is that not knowing the probability is not grounds for calling it safe.
On the other hand, giving up with "we can't know anyway" because of uncertainty is also inappropriate. Separating what is certain (the slowing trend and its reasons), what is uncertain (the threshold and timing), and how to find out (continued observation) leads to calm understanding.
Common misunderstandings: how to deal with media headlines
Headlines of "collapse in X years"
With each new study, strong headlines such as "AMOC to collapse within decades" circulate. Even when the paper itself carefully states "possibility," "premises" and "range," these tend to be dropped in headlines. There are three tips for checking.
- Look at the range (confidence interval) attached to the number
- Check whether it is a model or observation, and which scenario
- Compare with multiple studies and assessment reports
The gap with "movie-like sudden change"
Films depict an ice age arriving in days, but what is actually discussed is change on timescales of decades to centuries. Even if called abrupt, on the human sense of time it is a gradual change. There is no need to stoke panic, but neither is it a reason to leave it alone as "a matter for later."
"Slowing down" does not mean "heading toward collapse"
The gradual slowdown observed lies within the range of climate-model projections. While a slowdown may connect continuously to collapse, it may also settle into a new equilibrium while only slowed. Continued observation is essential to determine which way it is heading.

Checklist when reading headlines
- Check the range and premises of the number
- Distinguish models from observations
- Cross-check with multiple sources
What we can do: support observation, cut emissions, and prepare
Support observation
The most reliable way to reduce uncertainty is to keep observing. The RAPID team stresses the need to continue observations until at least 2034. Combining moored arrays in the Atlantic, Argo floats (instruments that dive and surface automatically to measure temperature and salinity) and satellite observations to leave a long, unbroken record will provide material for future decisions.
Cutting greenhouse gases is the best prevention
The weakening of the AMOC is tied to human-caused factors—warming and the melting of the Greenland ice sheet. Cutting emissions is therefore the most direct way to lower AMOC risk. That differences between scenarios are large means our choices can affect the outcome. For changes in the Arctic Ocean, see also Arctic sea-ice loss.
What residents and learners can do
- Check reliable sources (IPCC, observing agencies, peer-reviewed papers) as primary information
- When news goes viral, read the premises and ranges behind the numbers
- Support and share science communication on ocean observation and climate science
In daily life we cannot move the AMOC itself. But understanding accurately and taking part calmly in the discussion raises the quality of society's decisions.
Summary: understanding what is certain and uncertain separately
Key points of the discussion
- High certainty: under warming, the AMOC is likely to weaken through the 21st century (IPCC AR6)
- Large uncertainty: the threshold and timing of an abrupt collapse differ greatly between studies
- Current state of observation: about 20 years of RAPID data show a slowing trend, but the error margin is large and more time is needed to separate it from natural variability
- How to read: read probability figures together with their premises and ranges, and cross-check with multiple sources
Uncertainty is not a reason not to act but a reason to keep observing, cut emissions and read information carefully. Research will continue to be updated. The figures in this article are based on information published at the time of writing.
Summary of this article
- The AMOC is likely to weaken, but the timing and probability of collapse differ widely
- Observations span only about 20 years; firm conclusions need data beyond 2034
- Check ranges and premises of numbers and cross-check with several sources
References
- NOC:Tracking the AMOC for 20 years(2025年9月) – Summary of 20 years of RAPID observations and the need to continue
- IPCC 第6次評価報告書 第1作業部会報告書 – Assessment of the future AMOC (very unlikely / very likely)
- RAPID-AMOC Programme – AMOC observation data at 26°N
- McCarthy et al. (2025) Signal and Noise in the AMOC at 26°N, Geophysical Research Letters – Signal-to-noise of observations and the slowing trend
- Smolders, van Westen, Dijkstra (2024) Probability Estimates of a 21st Century AMOC Collapse – Probability estimates of collapse timing (arXiv)
- van Westen et al. (2024) Physics-based early warning signal shows that AMOC is on tipping course – Early warning signal research (arXiv)
- CLIVAR:Recent slowing of Atlantic overturning circulation as a recovery from earlier strengthening – Study viewing the recent slowdown as part of decadal variability
- Ben-Yami et al. (2023) Uncertainties too large to predict tipping times of major Earth system components – Uncertainty in predicting tipping timing (arXiv)
* Ordered by reliability: government and academic institutions > peer-reviewed papers > specialist bodies > reliable media