⚡ In short
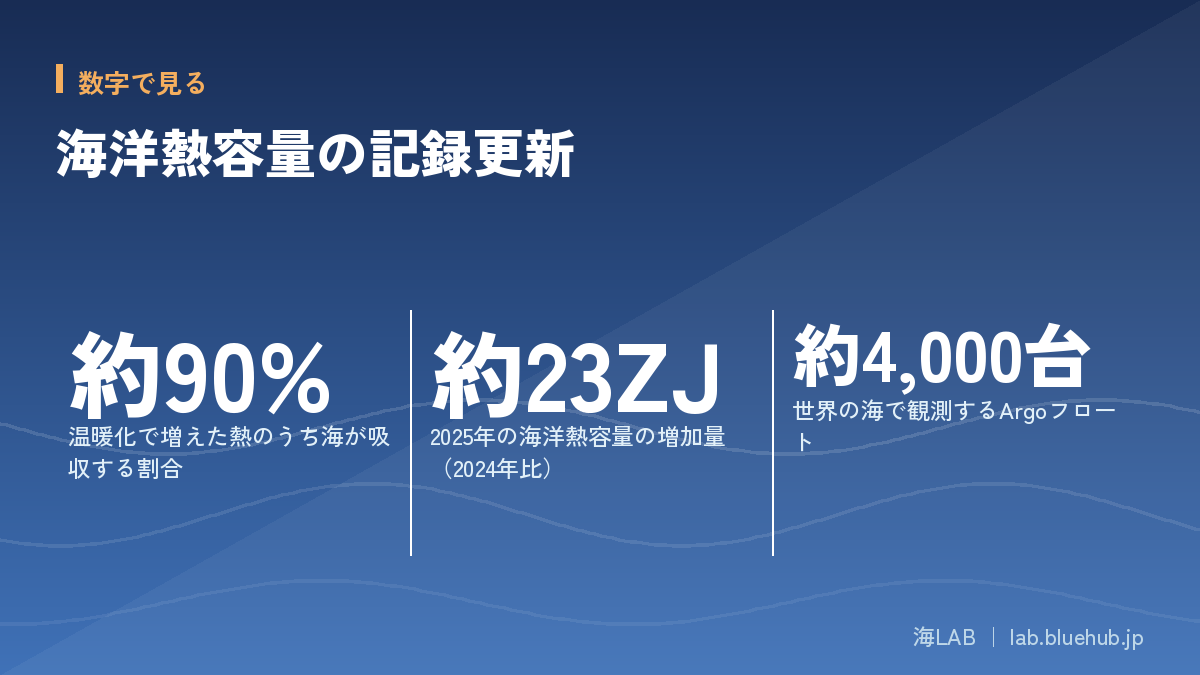
The ocean absorbs about 90% of the heat added by global warming. Learn what record-breaking ocean heat content (up about 23 ZJ in 2025) means, how Argo floats observe it, and how it affects Japan.
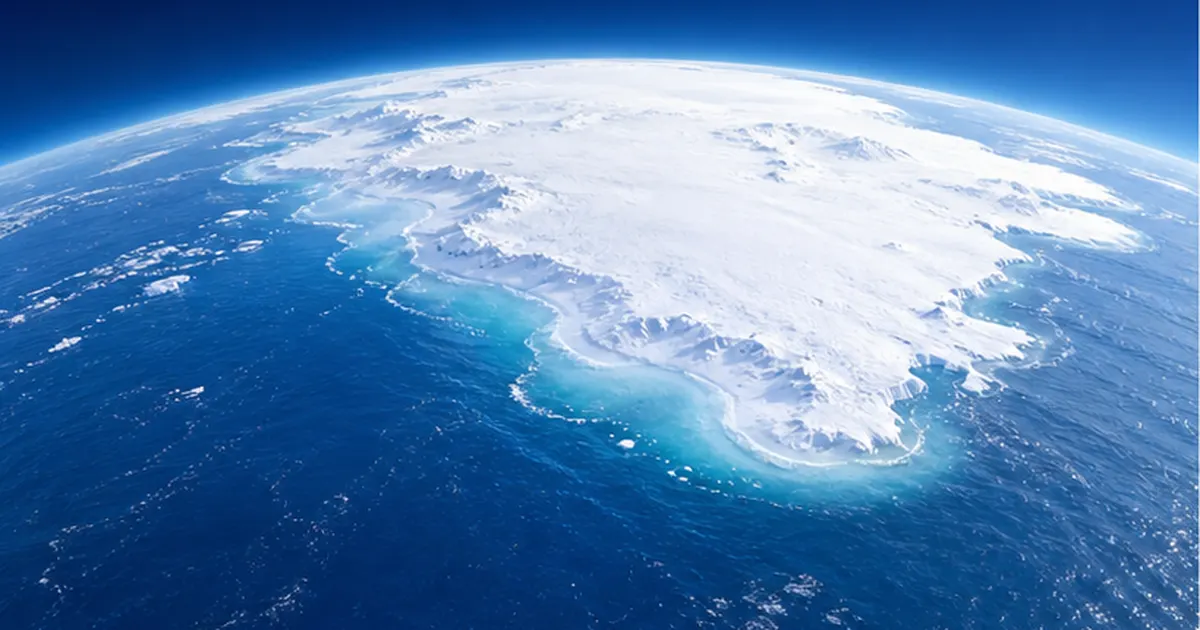
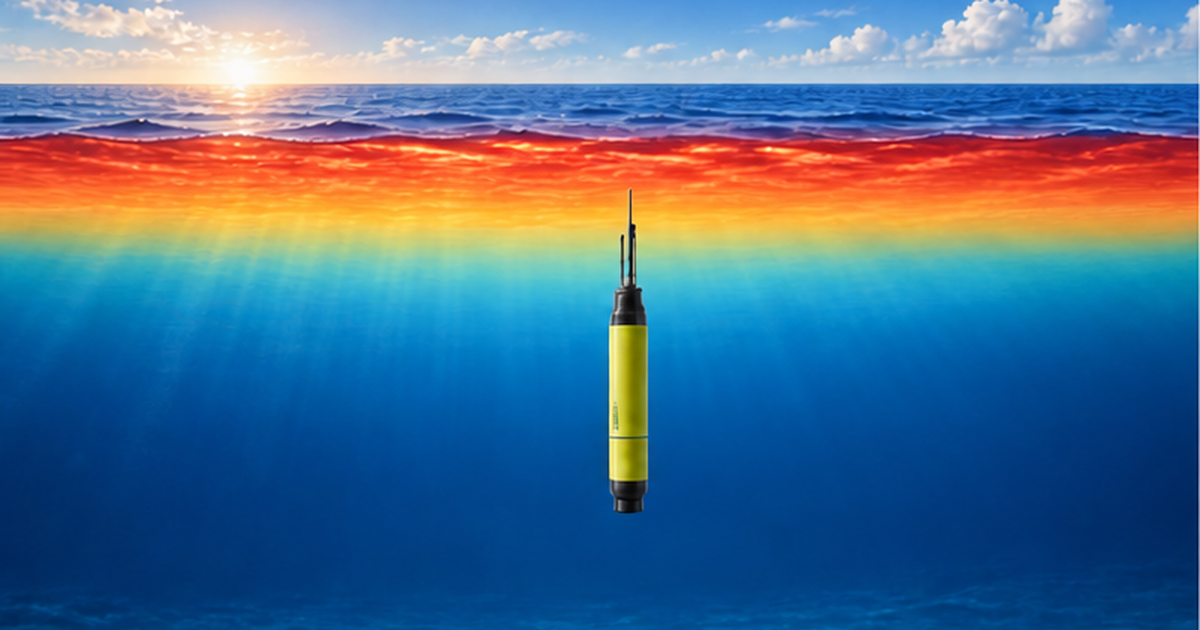
About 90% of the extra heat caused by global warming is actually absorbed by the ocean. Ocean heat content, the measure of that stored heat, was reported to have set a new record again in 2025.
Changes inside the ocean are invisible in air-temperature news. This article explains what ocean heat content means, how it is observed, and how it affects our lives.
The observations rely on Argo floats drifting throughout the world's oceans. Let's look at the science of measuring the ocean's unseen heat with numbers.
What you will learn
- What ocean heat content is
- Why about 90% of the heat ends up in the ocean
- What the 2025 record means
- How Argo floats observe the ocean
- Impacts on sea level, marine heatwaves and fisheries
What Is Ocean Heat Content? The Planet's "Heat Savings Account"
Definition of ocean heat content (OHC)
Ocean heat content (OHC) is the total thermal energy stored in seawater down to a given depth. It is measured in joules (J); for the whole ocean the numbers reach 1021 joules, or zettajoules (ZJ). If sea surface temperature is the ocean's "skin temperature," OHC shows how much heat has accumulated in the ocean as a whole, calculated by integrating temperature changes from the surface down to several hundred or 2,000 meters.
Air and sea surface temperatures swing widely from year to year because of El Niño and volcanic eruptions. OHC integrates heat through the deep layers, so short-term fluctuations are small and it steadily reflects which way Earth's energy balance is tilting. Climate scientists therefore regard it as one of the most reliable indicators of global warming.
Why does heat accumulate in the ocean?
As greenhouse gases increase, Earth absorbs more heat than it radiates to space, creating an energy imbalance. Most of this excess heat goes into the ocean. Water has a much larger specific heat than air, and the ocean covers about 70% of the planet with an average depth of roughly 3,700 meters. The heat contained in the entire atmosphere is said to be about the same as in just the top few meters of the ocean, which makes the sea an enormous heat reservoir.
Key points
- OHC is the ocean's heat integrated over depth and fluctuates little year to year
- About 90% of the extra heat from global warming is stored in the ocean
- It is expressed in zettajoules (ZJ = 1021 J)
About 90% of the Extra Heat Goes into the Ocean
The IPCC's breakdown of the heat
The IPCC Sixth Assessment Report (AR6), Working Group I, breaks down where the extra heat accumulated in the Earth system during 1971–2018 went: about 91% in the ocean, about 5% on land, about 3% in ice (ice sheets, sea ice and glaciers) and about 1% in the atmosphere. The rise in air temperature we feel is only a small part of the stored heat; most of it is quietly absorbed by the sea.
| Where the heat goes | Share (1971–2018) |
|---|---|
| Ocean | about 91% |
| Land | about 5% |
| Ice (ice sheets, sea ice, glaciers) | about 3% |
| Atmosphere | about 1% |
Assessment by the Japan Meteorological Agency
The Japan Meteorological Agency (JMA) explains that about 90% of the heat added by global warming is taken up by the ocean. Its 2020 announcement, based on an analysis down to 2,000 m depth, showed a large increase in ocean heat content between 1955 and 2019, with the pace accelerating since the mid-1990s. Converted into an average temperature rise of the whole layer the change looks small, but because the mass of the ocean is enormous, a slight rise in water temperature corresponds to a vast amount of heat.
The weight of "0.1°C"
Even a 0.1°C rise in the average temperature of the top 2,000 m of seawater requires heat equal to many tens of times the primary energy humanity consumes in a year. That is why a rise of just a fraction of a degree in the ocean must never be taken lightly.
A New Record in 2025: Recent Trends
Record highs for years in a row
A study published in January 2026 in Advances in Atmospheric Sciences reported that ocean heat content (down to 2,000 m) in 2025 set a new record. The increase over 2024 was about 23 zettajoules, described as the largest annual rise since 2017. Press coverage reports that about 16% of the ocean area recorded its highest heat content on record and about 33% ranked among the top three. The result combines several observational datasets and a reanalysis, and independent research groups have confirmed a similar trend.
Ocean heat content has risen almost continuously since the 1950s, and record-breaking has become nearly annual in recent years. Unlike air temperature, there is little room to say "this year was cooler"; it clearly shows that warming has not stopped.
The acceleration
JMA's analysis also shows that the increase in ocean heat content has accelerated since the mid-1990s. This is consistent with the growing energy imbalance as greenhouse gas concentrations rise. Because estimates differ slightly between research institutions, the figures in this article should be taken as reported estimates.
How to read the numbers
OHC estimates can differ by a few percent depending on the data and corrections used. However, the increasing trend is consistent across all analyses.
How Is It Measured? Argo Floats and Ocean Observation
How the Argo program works
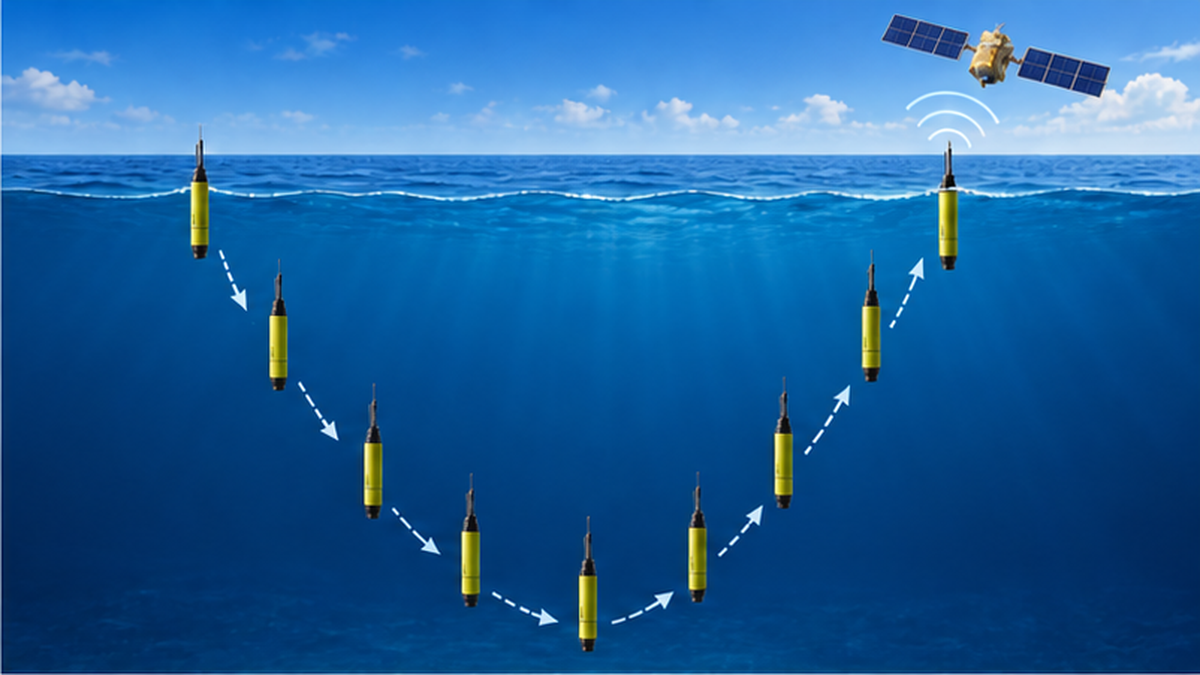
The main players in measuring the ocean's heat are the floats of the international Argo program. About 4,000 autonomous robots, called Argo floats, are deployed across the world's oceans. Roughly every 10 days each float dives to about 2,000 meters and then rises to the surface, recording temperature and salinity along the way. At the surface it transmits the data by satellite, and the data are freely available to everyone. Global deployment in the early 2000s let humanity monitor deep-ocean temperature on a global scale in near real time for the first time. According to the WMO, Argo has achieved 2 million profiles in about 20 years.
Observations before Argo and their limits
Before Argo, observations relied mainly on expendable bathythermographs (XBTs) dropped from ships and on research vessels. These were biased toward shipping lanes and certain areas, and coverage of the Southern Hemisphere and of winter seas was thin. Estimates of past ocean heat content therefore carry large uncertainties, and corrections and statistical gap-filling are still used for long-term estimates.
Challenges in the deep sea and polar regions
Most Argo floats observe down to 2,000 m. Deep Argo floats for greater depths are being developed, but observation points are still limited. In ice-covered polar regions floats cannot surface, so data are hard to obtain. Filling these "observation gaps" is a future task.
In Japan, JAMSTEC (Japan Agency for Marine-Earth Science and Technology) and JMA take part in the Argo program, contributing float deployment and data analysis.
What Happens When the Ocean Stores Heat? The Big Picture
Sea level rise: thermal expansion
Water expands when warmed. Thermal expansion of seawater is a major cause of sea level rise, and the IPCC assesses that about half of the 1971–2018 rise was due to it. In recent years the contribution of melting ice sheets and glaciers has also grown, but as long as heat keeps accumulating in the ocean, thermal expansion will continue. Heat that reaches deep layers does not return easily, so sea level is expected to keep rising for centuries even if emissions stopped now.
Marine heatwaves and ecosystems
As the ocean stores more heat, marine heatwaves, short-term high-temperature events, become more likely. Coral bleaching, loss of seaweed beds and shifts in fish distribution are typical examples. See also our related article What Is a Marine Heatwave?.

Fisheries and our daily lives
Rising water temperatures affect the distribution and catch of Japan's main fishery resources such as Pacific saury and salmon. See Ocean Warming and Fisheries for details. Warm seas also fuel typhoons and heavy rain, raising the risk of weather disasters.
Effects on the ocean's absorption capacity
As water warms, the amount of carbon dioxide and oxygen it can hold decreases. The ocean's role in softening warming (carbon uptake) could weaken; read this together with our article The Ocean's Role as a Carbon Sink.
What Is Happening in the Seas Around Japan
Rising water temperatures near Japan
According to JMA's long-term monitoring, sea surface temperature around Japan has risen by more than about 1°C per 100 years, faster than the global average. The rise is especially marked in the central Sea of Japan and in areas influenced by the Kuroshio. This trend directly affects fisheries, coastal ecosystems and weather.
The Kuroshio large meander and heat transport
The Kuroshio, flowing along Japan's south coast, is a "heat conveyor" carrying tropical heat northward. When it persists in a large meander, coastal temperature distributions change, affecting fishing conditions and weather. For the relationship between currents and temperature, see Ocean Warming and Changing Currents.
Effects on the coast
When sea surface temperatures are high, thermal expansion adds to sea level rise along Japan's coasts. See Sea Level Rise on Japan's Coasts for details.
Why Warming Sometimes Seems to "Stop"
The hiatus debate and the ocean
From the 2000s to the early 2010s there was a period when the rise in global average temperature seemed to slow temporarily, called the "global warming hiatus." Even then, Argo data showed that ocean heat content kept increasing. The heat had not vanished; it had moved into deeper layers.
El Niño and the redistribution of heat
During El Niño, Pacific heat is released into the atmosphere and global average temperature temporarily rises. During La Niña, heat tends to go down into the ocean. What matters is that even when air temperature rises and falls, the total heat in the ocean steadily increases.
What We Can Do: Understanding and Action
Cutting emissions and adapting
To curb the increase in ocean heat content, the fundamental answer is to reduce greenhouse gas emissions and narrow Earth's energy imbalance. At the same time, adaptation measures for unavoidable sea level rise and marine heatwaves (coastal protection, fisheries transition, coral reef conservation) are important.
Supporting observation
Observation networks such as Argo rely on international cooperation and continuing funding. Their data are used in weather forecasting, fishery forecasts and climate model validation, which are directly tied to our lives. Understanding the value of observation is itself a form of support.
How to read the information
- A cooler year does not necessarily mean warming has stopped
- The latest OHC values differ slightly between research institutions
- When reading news figures, check the unit (ZJ) and the depth covered
What you can do today
- Regularly check JMA's ocean monitoring information
- Keep up everyday emission cuts, such as choosing energy saving and renewables
- Share articles and materials about ocean change with family and friends
Summary: The Ocean Is the Front Line of Warming
The ocean takes in about 90% of the heat added by global warming, and ocean heat content was reported to set another record in 2025. Thanks to observation networks such as Argo floats, we can now follow hard-to-see changes inside the ocean with numbers. Stored ocean heat comes back to our lives in many ways: sea level rise, marine heatwaves, fisheries and weather. Let's take the first step to protect the ocean through everyday actions and an accurate understanding of the facts.
Summary of this article
- OHC is a stable indicator of the progress of global warming
- About 90% of the extra heat (about 91% in IPCC AR6) is stored in the ocean
- 2025 saw an increase of about 23 ZJ, setting a record
- Argo floats monitor temperature down to 2,000 m
- Stored heat affects sea level, marine heatwaves and fisheries
References and Sources
- JMA: Ocean heat content (2019 was the highest in the monitoring period) – 2020 press release
- IPCC AR6 WG1 Chapter 7: Earth's Energy Budget – Heat breakdown
- IPCC AR6 WG1 Chapter 9: Ocean, Cryosphere and Sea Level Change – Sea level rise and thermal expansion
- Argo official website – International Argo program
- WMO: Argo achieves 2 million profiles in 20 years – WMO news
- Advances in Atmospheric Sciences (2026): Ocean heat content in 2025 – Springer
- JAMSTEC Argo – Japan's Argo program
- JMA: Ocean health check tables – Sea surface temperature around Japan
* Listed in order of reliability: government and academic institutions > peer-reviewed papers > specialist organizations > reliable media.