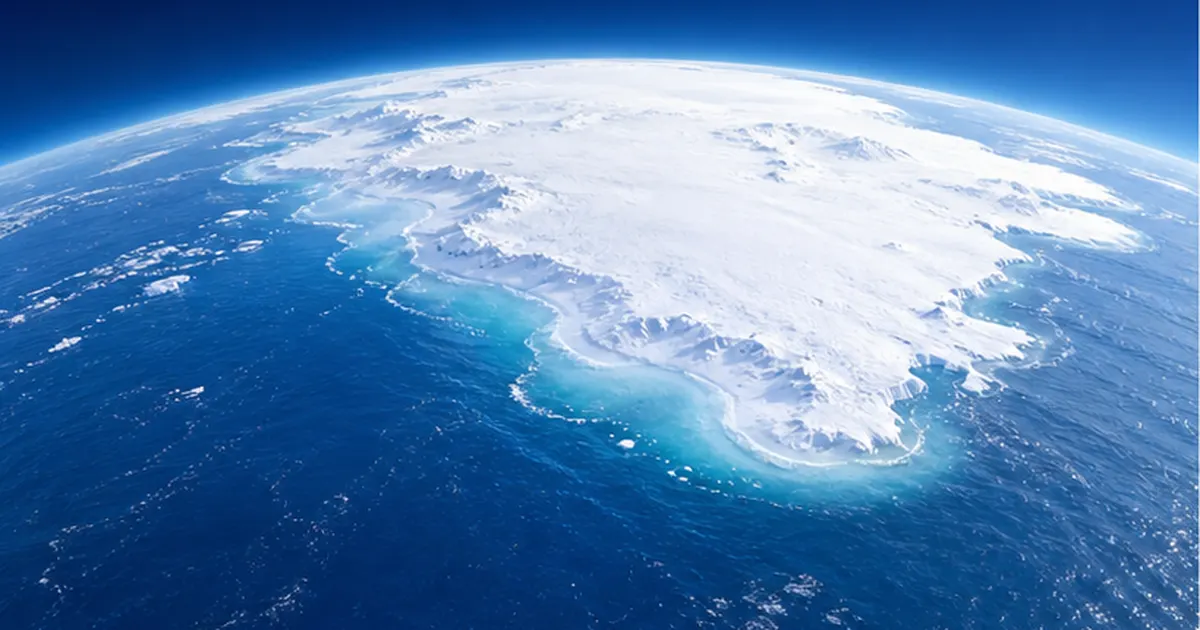
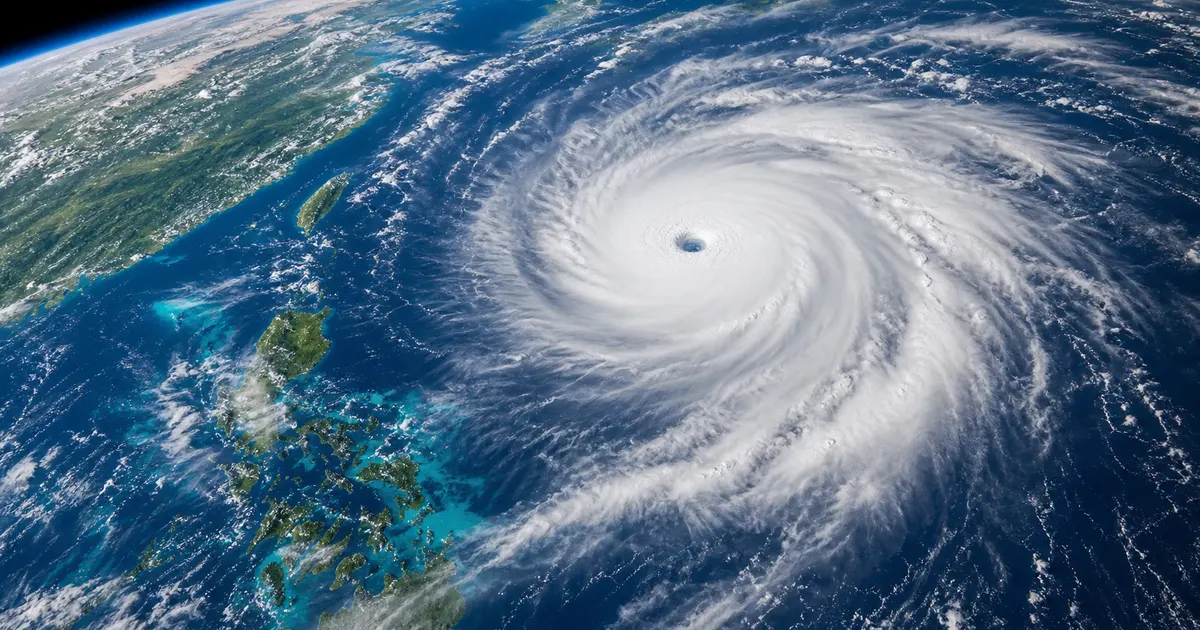
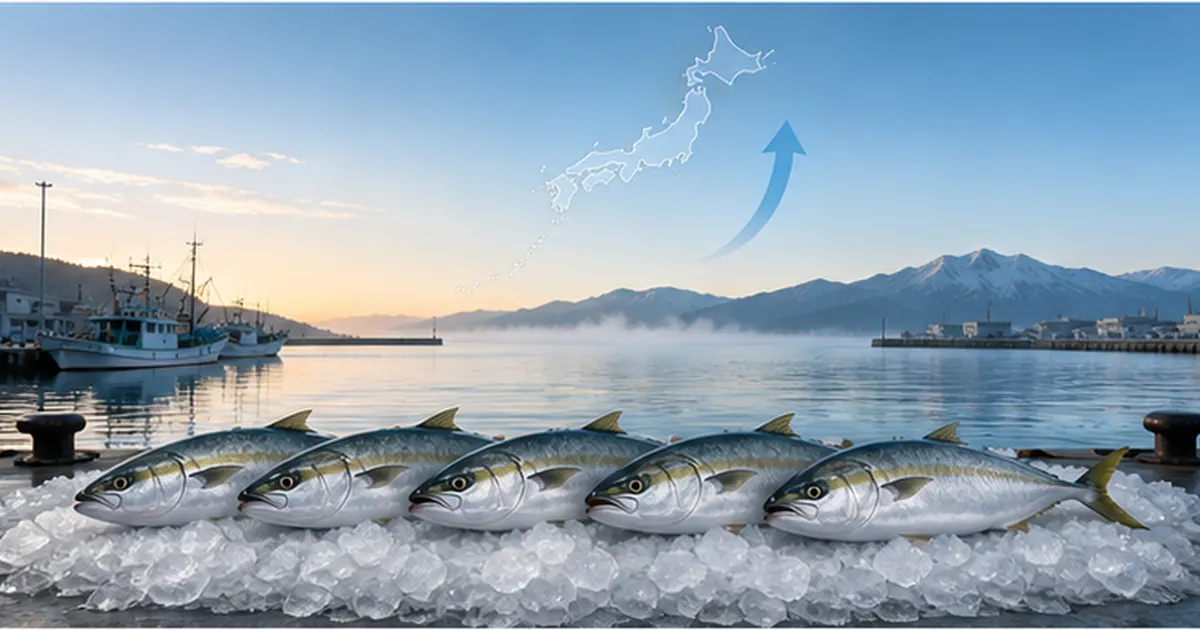
Right now, the ocean is quietly absorbing nearly a third of the carbon dioxide (CO2) humanity keeps pumping into the atmosphere. According to the latest report from the Global Carbon Project, 29% of anthropogenic CO2 emissions over the past decade were absorbed by the ocean — more than the 21% taken up by forests and soils on land. If the ocean had stopped doing this, atmospheric CO2 concentrations and warming would already be far more severe than they are today.
But this role as the "world's largest carbon sink" comes with a hidden cost. CO2 dissolved in seawater triggers a chemical reaction that gradually pushes the ocean toward the acidic side. This is "ocean acidification," and it is already hindering the growth of corals, shellfish, and other organisms that build shells and skeletons — casting a shadow over Japan's fisheries as well.
This article draws on observation data from the Japan Meteorological Agency, the Global Carbon Project, and JAMSTEC to walk through how and how much the ocean absorbs CO2, the reality of the acidification that results, and the latest technologies aiming to boost the ocean's absorption capacity.
What you'll learn in this article
- The ocean has absorbed about 29% of anthropogenic CO2 emissions over the past decade, more than the 21% absorbed by land ecosystems, making it the largest natural carbon sink
- CO2 is transported into the ocean interior and isolated from the atmosphere via two pathways: the "solubility pump" and the "biological pump"
- As a cost of this absorption, seawater pH has fallen by about 0.1 since before the Industrial Revolution — a phenomenon called "ocean acidification"
- Acidification harms organisms such as corals, shellfish, and sea urchins that build shells and skeletons from calcium carbonate
- Acidification and declining aragonite saturation have also been observed in waters around Japan, raising risks for the fishing industry
- As warming progresses, the ocean's buffering capacity weakens, which could slow the future growth of CO2 uptake
What Share of Humanity's CO2 Does the Ocean Take On?
According to "Global Carbon Budget 2025," published in 2025 by the international research team Global Carbon Project, about 29% of the CO2 emitted by human activity over the past decade (2015-2024) was absorbed by the ocean. Over the same period, forests and soils on land absorbed 21% — less than the ocean. Looking at the cumulative total since the early Industrial Revolution in 1850, the ocean has absorbed roughly 27% of anthropogenic CO2 emissions.
The portion neither absorbed by the ocean nor taken up on land remains in the atmosphere, directly driving up atmospheric CO2 concentrations and global warming. In other words, the ocean's absorption capacity effectively "buys time" by slowing the pace of warming. If ocean absorption had been zero, simple calculations suggest that far more CO2 would remain in the atmosphere today, and the temperature rise since the Industrial Revolution would likely have been much sharper.
The ocean is believed to have absorbed about a quarter of the carbon dioxide released into the atmosphere by human activity.
— Japan Meteorological Agency
The Ocean Already Stores 50 Times More CO2 Than the Atmosphere
According to the Japan Meteorological Agency (JMA), the ocean already stores about 50 times more CO2 than exists in the atmosphere, and has absorbed roughly a quarter of the CO2 released into the atmosphere by human activity. Based on JMA observations, the ocean has absorbed an average of 2.1 billion tons (carbon equivalent) per year between 1990 and 2024. This uptake fluctuates on a scale of several years to a decade but has trended upward over the long term.
For 2024 alone, the ocean's CO2 uptake is estimated at about 3.4±0.4 gigatons of carbon, while a preliminary estimate for 2025 puts it slightly lower, at about 3.2 gigatons of carbon, reflecting the end of El Niño conditions. Despite year-to-year swings, the ocean's absorption has continued to trend upward over the decades — a consequence of the fact that as long as atmospheric CO2 concentration keeps rising, the concentration gradient drives seawater to dissolve more of it.
How It Differs from Land-Based Sinks
Land-based carbon uptake fluctuates significantly from year to year due to droughts, wildfires, and heatwaves. In fact, a drop in tropical land carbon uptake in 2023 has been reported to have pushed up the rate of atmospheric CO2 increase. Ocean absorption, by contrast, shows relatively small year-to-year swings, giving it the character of a "stable sink" that underpins the global carbon budget. This stability is one reason the ocean is regarded as especially important for climate action.
| Destination | Share over the past decade (Global Carbon Budget 2025) | Notes |
|---|---|---|
| Ocean | About 29% | Transported into the ocean interior via the solubility pump and biological pump; relatively stable with small variation |
| Land ecosystems (forests, soil, etc.) | About 21% | Carbon fixation through photosynthesis; large year-to-year variation from droughts and wildfires |
| Atmosphere (unabsorbed portion) | The remaining majority | Directly drives rising CO2 concentration and warming |

These figures are "living data," updated year after year. The Global Carbon Project publishes the latest Global Carbon Budget around November each year, continually revising its estimates of emissions and uptake for prior years. The ocean's 29% absorption share is not a fixed number — it should be understood as something that will be fine-tuned as data is updated going forward.
How the Ocean Absorbs Carbon Dioxide: The Solubility Pump and the Biological Pump
Why can seawater dissolve such a huge amount of CO2? There are two major pathways by which the ocean draws in CO2 from the atmosphere and sends it into the deep sea. In explanations from the Japan Meteorological Agency and JAMSTEC, these are called the "solubility pump" and the "biological pump." Both rely on the CO2 concentration gradient between the atmosphere and seawater, and both carry carbon captured at the surface deep into the ocean.
① The Solubility Pump: Physical and Chemical Uptake
CO2 is a gas that dissolves readily in water, and its solubility increases as water temperature drops. Cold surface water at high latitudes, having dissolved large amounts of CO2, becomes denser than the surrounding water and sinks, carrying that carbon down into the deep sea in regions such as the North Atlantic and the Southern Ocean. This physical and chemical process by which surface CO2 is "transported" into the ocean interior is the solubility pump. CO2 carried into the deep sea rides the deep ocean circulation — sometimes called the ocean's "conveyor belt" — slowly circling the globe over centuries to a millennium.
② The Biological Pump: Transport by Living Organisms
In the sunlit surface layer, phytoplankton convert CO2 into organic matter through photosynthesis. The remains and waste of phytoplankton, the zooplankton that eat them, and fish sink toward the seafloor as "marine snow," carrying carbon into the deep sea as they decompose. This is the biological pump, one of the main pathways for carbon sequestration in the ocean interior. Much of the organic matter is broken down partway through the water column as it sinks, but some reaches the deep seafloor, where the carbon remains isolated from the atmosphere for centuries to millennia.
How the Two Pumps Support Each Other
The solubility pump and the biological pump do not operate independently. When phytoplankton photosynthesis lowers the CO2 concentration at the surface, more CO2 from the atmosphere can dissolve in, which is then carried into the deep sea by sinking water — the two processes reinforce each other. The balance between them varies by region and season, with the biological pump tending to play a larger role in nutrient-rich high-latitude waters and upwelling zones.
The Difference Between the Two Pumps
- Solubility pump: A physical and chemical process in which CO2 dissolves directly into seawater and is carried into the deep sea as cold, dense water sinks
- Biological pump: A biological process in which carbon is carried into the deep sea through phytoplankton photosynthesis and the sinking of dead organisms and waste
- Both operate simultaneously, together shaping the ocean's total carbon uptake
- Carbon carried into the deep sea remains isolated from the atmosphere for centuries to millennia

Across the ocean as a whole, the solubility pump tends to dominate at high latitudes, while the biological pump tends to be strongest in nutrient-rich upwelling zones and areas of seasonal plankton blooms. In the waters around Japan, the mixing zone where the Oyashio and Kuroshio currents meet is known for its nutrient richness and high plankton productivity — making it one of the "carbon gateways" where the biological pump is especially active.
How the Japan Meteorological Agency Keeps Watch Over CO2 Uptake Near Japan
Since the 1990s, the Japan Meteorological Agency has conducted regular ocean observations along fixed observation lines, including the 137°E and 165°E lines, using research vessels. Through continuous measurement of surface seawater CO2 partial pressure (pCO2) and chemical analysis of collected water samples, the agency has tracked long-term changes in CO2 uptake by region.
The Steady Work of Repeat Hydrographic Observations
By following nearly the same routes every year and sampling and analyzing seawater at the same points, JMA's research vessels can identify "long-term trends" after filtering out seasonal variation and multi-year fluctuations such as El Niño and La Niña. This is data that can never be obtained from a single survey — it only emerges through the steady accumulation of continuous observation. The 137°E line runs from Japan toward the equator, while the 165°E line runs from Japan toward Australia, allowing comparison of data with different characteristics across latitudes.
What Is Being Measured, and How
Automated instruments aboard the research vessels continuously draw in surface seawater while underway, measuring the difference in CO2 partial pressure between the atmosphere and the seawater. A positive difference means the ocean is absorbing CO2 from the atmosphere; a negative difference means CO2 is being released from the ocean to the atmosphere. Some regions and seasons shift toward the release side — it is only by averaging across the entire globe that the conclusion "the ocean is a carbon sink" holds.
The Value of Decades of Data
These observations may not be glamorous, but they only become meaningful as a "trend" once decades of data have accumulated. Looking at the measurement from a single voyage alone, it is impossible to tell whether it reflects natural variability or a long-term change. It is precisely because JMA has continued observing along the same routes with the same methods that it can now describe the rate of change in CO2 uptake and pH near Japan with decade-scale precision.
- Measured items: surface seawater CO2 partial pressure, pH, total dissolved inorganic carbon, alkalinity, and more
- Frequency: several times a year along each observation line, continued over decades
- Methods: continuous measurement while underway combined with sampling analysis at fixed points
- Public data: JMA publishes regional trends over time in its "Ocean Health Check Report"
What Is the "Ocean Health Check Report"?
A collection of long-term marine environmental monitoring data published by the Japan Meteorological Agency. Much like a regular medical checkup for the ocean, it periodically tracks not only water temperature and currents but also CO2 uptake and pH changes, and makes the data available to anyone via the web. It is referenced by researchers as well as by educators and the media.
This data is compiled not only by JMA but also in coordination with JAMSTEC's research vessels and observation networks operated by countries around the world. Data shared through the international ocean observation program "GO-SHIP" and similar frameworks forms the foundational data underpinning international efforts such as the Global Carbon Budget, which calculates the global CO2 balance. Japan's repeat hydrographic observations are one important piece supporting this global-scale carbon budget estimation.
The Cost of Absorption: What Is Ocean Acidification?
While the ocean absorbing CO2 might seem like a good thing overall, it comes with a cost rooted in chemistry. When CO2 dissolves in seawater, it reacts with water (H2O) to form carbonic acid (H2CO3), which splits into hydrogen ions (H+) and bicarbonate ions (HCO3-). As hydrogen ions increase, seawater shifts toward the acidic side. This is the phenomenon known as "ocean acidification."
Today's seawater is weakly alkaline, with a surface pH of about 8.1. The average pH before the Industrial Revolution is estimated to have been around 8.17, meaning surface seawater pH has fallen by about 0.1 to date. Because pH is measured on a logarithmic scale, a drop of just 0.1 corresponds to roughly a 30% increase in hydrogen ion concentration — that is, acidity. Though the number looks small, it represents a remarkably fast change in chemical terms.
How pH Changes With Depth
Seawater pH also varies with depth. In the subtropical northwestern Pacific, surface pH is about 8.1, but it decreases with depth, dropping to around 7.4 at depths near 1,000 meters in some areas. This is because CO2 generated by the decomposition of organic matter tends to push deeper waters further toward the acidic side — showing that acidification is not just a surface phenomenon but one that affects the ocean's entire vertical structure.
Acidification Is Also Progressing Near Japan
JMA observations have confirmed that surface seawater pH in the waters of the northwestern Pacific extending south from off the Kii Peninsula has been declining at a rate of about 0.02 per decade. In the waters around Japan, the decline was 0.022 per decade over the period from 1998 to 2024 — a pace roughly on par with the global average rate of decline (0.018 per decade). This is not a localized phenomenon; it is progressing in step with the rest of the world's oceans. Globally, surface seawater pH is also reported to have fallen by about 0.06 since 1990.
Seawater's "Buffering Capacity" Is Also Changing
Seawater naturally has a buffering capacity that moderates pH changes even as CO2 dissolves into it. However, it is known that this buffering capacity itself weakens as acidification progresses. In other words, acidification is not simply "a slight drop in pH and that's it" — it is part of a longer-term process in which seawater's chemical nature gradually shifts from being able to readily absorb CO2 to being less able to do so.

Ocean acidification is sometimes called "the other face of global warming." If warming is the effect of rising atmospheric CO2 concentration on temperature, acidification is the effect of that same rising CO2 concentration on the chemical properties of seawater — sharing a common cause but manifesting differently. In both cases, the fundamental countermeasure is reducing CO2 emissions; the two cannot be considered separately.
How Acidification Affects Marine Life
As acidification progresses, the concentration of carbonate ions in seawater decreases. Carbonate ions are the building blocks of calcium carbonate (aragonite and calcite) used by corals, shellfish, sea urchins, and coccolithophores to build their shells and skeletons — a shortage makes it harder for these calcifying organisms to build them.
The Aragonite Saturation Indicator
The indicator used to express how readily calcium carbonate can be formed is the "aragonite saturation state (Ω)." When Ω is greater than 1, calcium carbonate precipitates readily (shells can be formed); when it falls below 1 into an "undersaturated" state, there is a risk that existing shells and skeletons will begin to dissolve. Data from waters near Japan show that aragonite saturation declined from 3.6 to 3.4 between 1994 and 2008. It has not yet reached undersaturation, but the decline is steadily progressing.
Impacts Spreading from Low to High Latitudes, and Into the Deep Sea
Aragonite saturation tends to be lower in high-latitude and deep-sea waters, where temperatures are already low and CO2 dissolves more readily. This means that as acidification progresses, the high-latitude and deep-sea regions where saturation was already barely maintained will be the first to approach undersaturation. Around the Arctic and Southern Oceans, seasonal undersaturation has already been reported in some areas, suggesting that calcifying organisms living in cold waters may be affected at an earlier stage.
Vulnerability Varies by Life Stage
Even within the same species, tolerance to acidification varies greatly by life stage. Egg and larval stages generally form shells and skeletons in a more delicate way than adults and are more sensitive to changes in the surrounding chemical environment. If sufficient calcium carbonate cannot be taken up during this period, more individuals die before they can progress to later growth stages. This is the ecological reason why discussions of aquaculture impacts often focus on the "juvenile and larval stage."
| Organism | Expected impact |
|---|---|
| Corals | Impaired skeleton formation; reduced recovery ability due to combined stress with bleaching |
| Shellfish (oysters, scallops, etc.) | Impaired shell formation in juveniles, potentially reducing growth and survival rates |
| Sea urchins | Impact on skeleton and spine formation; increased vulnerability during the larval stage |
| Coccolithophores and foraminifera | Reduced productivity of these microscopic calcifying plankton, with ripple effects on the base of the food chain |
What Happens When Water Becomes "Undersaturated"
In undersaturated seawater, where aragonite saturation falls below 1, the chemical reaction shifts toward dissolving the calcium carbonate shells that organisms have built. This means not only that new shells become harder to form, but that even maintaining existing shells becomes difficult.

From a food-chain perspective, the impact may not be limited to calcifying organisms alone. Coccolithophores, foraminifera, and pteropods (a group of tiny swimming snails) are an important food source for many fish, including salmon and herring. If the productivity of these organisms declines due to acidification, it could indirectly affect the abundance of fish that do not themselves have shells — and ecosystem-wide impact assessments are underway in various parts of the world.
Risks to Japan's Fisheries and Tourism
In Japan, where seafood consumption is high, ocean acidification is both an environmental issue and a risk to industry and food supply. In shellfish and crustacean aquaculture, impaired shell formation during the juvenile and larval stages could affect growth and survival rates — a concern that is not negligible for Japan's major farmed species, including oysters and scallops.
Concerns for Aquaculture
In shellfish farming, the early stages of spawning and free-swimming larvae are considered most vulnerable to acidification. If shells cannot form properly during this period, more individuals may die before reaching later growth stages. In North America, mass mortality of oyster larvae has actually occurred at farms that drew in acidified seawater — a situation that is not someone else's problem for Japan's aquaculture industry either.
Ripple Effects on Coral Reefs, Fisheries, and Tourism
In regions with coral reefs, such as Okinawa, rising water temperatures cause bleaching, and when combined with acidification's impairment of skeleton formation, coral's own capacity to recover may decline. Coral reefs are a tourism resource for activities like diving, and at the same time serve as spawning and nursery grounds for many fish species, meaning the impact could ripple into fishery resources as well. If the productivity of microscopic calcifying plankton such as coccolithophores and foraminifera declines, the effects could cascade to the fish that feed on them and further up the ecosystem.
- Aquaculture: impact on shell formation during the juvenile stage of shellfish and crustaceans
- Fisheries: risk of declining function in spawning and nursery grounds such as coral reefs and seagrass beds
- Tourism: impact on diving resources from coral bleaching and impaired growth
- Food security: a long-term supply risk for Japan, where seafood consumption is high
To prepare for these risks, some aquaculture operations are researching countermeasures such as real-time monitoring of seawater pH and aragonite saturation, and drawing water at times or from locations less prone to acidification. While it is difficult to halt ocean acidification at the local level, there is growing emphasis on adaptive measures that anticipate when impacts are likely and minimize the resulting damage.
Is There a Limit to the Ocean's Absorption Capacity? IPCC Future Scenarios
Will the ocean continue absorbing CO2 at the same pace going forward? Analysis in the IPCC's Sixth Assessment Report (AR6), Working Group I, indicates that as long as atmospheric CO2 concentration continues to rise, the total amount absorbed by both ocean and land will keep increasing — but the share of emissions absorbed will decline.
Warming Itself Weakens Absorption Capacity
Under high-emissions scenarios (SSP4-6.0 and SSP5-8.5), rising surface seawater temperatures are projected to reduce seawater's CO2 buffering capacity, slowing the growth of ocean uptake after 2050. Under a low-emissions scenario (SSP1-2.6), the growth rate of atmospheric CO2 itself slows, so the growth of uptake naturally moderates as well. CMIP6 model estimates suggest that cumulative ocean carbon uptake since 1850 will settle at about 290±30 gigatons of carbon under SSP1-2.6, while reaching about 520±40 gigatons of carbon by 2100 under SSP5-8.5.
Another Risk: Changes in Ocean Circulation
Rising seawater temperatures affect not only buffering capacity but also large-scale ocean circulation itself. Under high-emissions scenarios, warming and freshening of surface waters reduce density differences, potentially weakening the circulation that drives sinking into the deep sea. If circulation weakens, the transport of carbon into the deep sea could stall, increasing the amount of carbon captured by the biological pump that returns to the surface before reaching the deep sea. In this case, changes in biological production driven by temperature and the weakening of circulation would occur simultaneously, making impacts more complex to predict.
Key Points on Future Scenarios
- The higher the emissions, the more the ocean's absorbed "amount" will grow, but the absorbed "share" will decline
- Warming reduces seawater's buffering capacity, and under high-emissions scenarios, the growth of ocean uptake is projected to slow after 2050
- Under low-emissions scenarios, the growth of atmospheric CO2 itself slows, and the growth of uptake naturally moderates as well
- Weakening ocean circulation also risks stalling the transport of carbon into the deep sea
- Under no scenario does the ocean take on all emissions indefinitely
These future projections vary across models and carry uncertainty. What they share, however, is the conclusion that the ocean's absorption capacity is not "an infinite buffer that will absorb ever more no matter how much we emit." It is important to understand that the buffering role the ocean has played is merely giving humanity a grace period in which to pursue emissions reductions.
New Technology to Boost the Ocean's Absorption Capacity: Ocean Alkalinity Enhancement
Research and development aimed at artificially enhancing the ocean's natural absorption capacity has also become more active in recent years. A leading approach is "Ocean Alkalinity Enhancement" (OAE), a technology that adds alkaline substances to seawater to boost its carbonate buffering capacity, allowing it to dissolve more CO2 from the atmosphere. In theory, it is drawing attention as a "two birds, one stone" approach that could advance CO2 removal while locally mitigating ocean acidification.
2025: The Year Field Trials Got Underway
The field of OAE has been advancing into the demonstration stage. Canada's Planetary Technologies issued the world's first third-party-verified OAE carbon credit in 2024. Ebb Carbon, based in the United States, has been conducting a two-year demonstration project called "Project Macoma" with the U.S. Department of Energy's Pacific Northwest National Laboratory, and began operations in Port Angeles, Washington, in October 2025. The "LOC-NESS" project, led by the Woods Hole Oceanographic Institution, reported that a field trial off the coast of Maine captured between 2 and 10 tons of atmospheric CO2 into the ocean during a four-day monitoring period.
Challenges Remain for Large-Scale Deployment
On the other hand, these early field trials and model analyses have reported that CO2 removal from small-scale efforts has shown almost no measurable impact on surrounding protected areas. Conversely, this also means that it remains unclear what effects would arise for ecosystems and ocean chemistry if efforts were scaled up globally to a level meaningful for CO2 removal. Technologies that "boost" the ocean's absorption capacity are positioned not as a cure-all for halting acidification, but as an evolving option that must be carefully verified alongside emissions reductions.
Where Ocean Carbon Dioxide Removal (CDR) Fits In
Ocean CO2 removal technologies such as ocean alkalinity enhancement are being researched strictly as a complement to emissions reductions. In the scientific understanding reflected by the IPCC and others, reducing CO2 emissions themselves remains the foundation of climate action, with removal technologies positioned as an "additional measure" layered on top.
Interest in ocean-based CO2 removal technology is also growing within Japan. Reports of demonstration projects by research institutions and companies are beginning to emerge, and going forward, technology verification tailored to the environmental characteristics of Japan's coastal waters is likely to become an important task. As an island nation surrounded by ocean, Japan needs to carefully weigh both the benefits and the risks of these technologies even more closely than other countries.
What We Can Do
The ocean's role as the "world's largest carbon sink" will grow stronger or weaker depending on future emissions levels. The fundamental countermeasure is reducing CO2 emissions themselves, but protecting the ecosystems that support the ocean's absorption capacity is also an important option.
Coastal ecosystems such as mangroves, seagrass meadows, and other vegetated shallows serve as "blue carbon" that stores atmospheric CO2 over the long term. Conserving and restoring these ecosystems does not directly mitigate ocean acidification, but efforts are underway around the world as one of the few nature-based ways to offset CO2 emissions. For more, see our articles on how blue carbon works and the limits of the ocean's carbon absorption.
Companies and local governments are not only setting CO2 emissions reduction targets but also beginning to incorporate consideration of acidification risk into seafood procurement policies within their supply chains. Opportunities for individuals to get directly involved are limited, but knowing about and supporting these corporate and government efforts can also serve as indirect support.
What individuals can do may not seem like much, but reducing emissions is fundamentally built on the accumulation of everyone's actions. In addition, for a slow-moving, hard-to-notice change like ocean acidification, simply knowing accurate data and staying engaged has value in itself. Because changes in the ocean take time to become visible, there is a need for society as a whole to share observation data as an "early warning system."
- Reducing everyday CO2 emissions (energy conservation, renewable energy use, etc.) is the most fundamental countermeasure
- Support the conservation and restoration of blue carbon ecosystems such as mangroves and seagrass meadows
- Stay engaged with observation data from public institutions like the Japan Meteorological Agency and JAMSTEC, and keep track of changes
- Pay attention to trends in research on acidification countermeasures in fisheries and aquaculture
Start by Knowing
Ocean acidification is a slow-moving change that is hard to notice. That's exactly why regularly checking observation data published by the Japan Meteorological Agency and JAMSTEC — and continuing to "know" about the changes — is the first step.

References and Sources
- Global Carbon Project – Global Carbon Budget 2025 (published in ESSD/Copernicus)
- Japan Meteorological Agency – Ocean CO2 data and observation knowledge
- Japan Meteorological Agency – Knowledge on ocean acidification
- Japan Meteorological Agency – Ocean Health Check Report: Long-term trend in global surface seawater pH
- Japan Meteorological Agency – Ocean Health Check Report: Future projections of ocean acidification near Japan
- Japan Agency for Marine-Earth Science and Technology (JAMSTEC) – Monitoring the progress of acidification in Japan's coastal waters (press release)
- Japan Agency for Marine-Earth Science and Technology (JAMSTEC) – Ocean acidification is also occurring in the seas around Japan
- IPCC – AR6 WG1 Chapter 5: Global Carbon and other Biogeochemical Cycles and Feedbacks
- National Institute for Environmental Studies, Japan – Q9: Impacts of global warming, ocean acidification
- Japan Science and Technology Agency (JST) – CO2 removal via seawater: the potential of ocean alkalinity enhancement
※ Listed in order of reliability: government and academic institutions > peer-reviewed papers > specialized organizations > reputable media