⚡ In short
Since the Industrial Revolution the ocean has absorbed roughly a quarter of the CO2 humans have emitted, making it the planet's largest carbon sink. Yet climate change has already made that uptake about 7% smaller than it would otherwise be, and in the record-hot year of 2023 the ocean took up about 10% less than expected. This article explains how the ocean's carbon pumps work and what the signs of saturation really mean, using data from the Japan Meteorological Agency, the IPCC and the latest peer-reviewed studies.
Without the ocean, global warming would already be far worse than it is. Roughly a quarter of all the carbon dioxide humans have released by burning coal and oil has been quietly taken up by the sea. The ocean never complains and never sends an invoice, which is why this enormous free service has long been treated as a given.
That assumption is now starting to crack. The Global Carbon Budget 2025 assessment estimates that the effects of climate change have already made the ocean sink about 7% smaller than it would otherwise have been. And in 2023, the hottest year ever recorded at the sea surface, peer-reviewed research found that the ocean took up about 10% less CO2 than expected. The ocean sink is not something that simply grows forever. Depending on conditions it can slow down, and in some places it can even run in reverse. That is what the data has begun to say.
This article starts with the basics of how the ocean takes up CO2 and where it stores it, then works through the four factors that put a brake on that process, the signs of weakening already visible in observations, and finally ocean acidification, the second invoice that comes attached to all of this. Some chemistry is unavoidable, but each term is translated into everyday language as we go. By the end you should be able to judge for yourself what a headline about a weakening ocean carbon sink does and does not mean.
What you'll learn in this article
- Why the ocean is called the planet's largest carbon sink, and how much it has actually absorbed
- How the three pumps that carry CO2 into the deep ocean work: solubility, biological and carbonate
- The four brakes that slow the ocean's uptake: buffer capacity, temperature, stratification and biology
- The observational evidence that the sink is already weakening, and what happened in 2023
- How ocean acidification erodes the very capacity that absorbs carbon, creating a self-amplifying loop
- Long-term observations from the seas around Japan, and the realistic options available to us
The Ocean Is the Planet's Largest Carbon Sink: How Much Has It Absorbed?
Most people have heard at some point that the ocean absorbs CO2. Far fewer can picture the scale of it in concrete numbers. That is where we begin.
Since the Industrial Revolution, the ocean has taken on about a quarter of our emissions
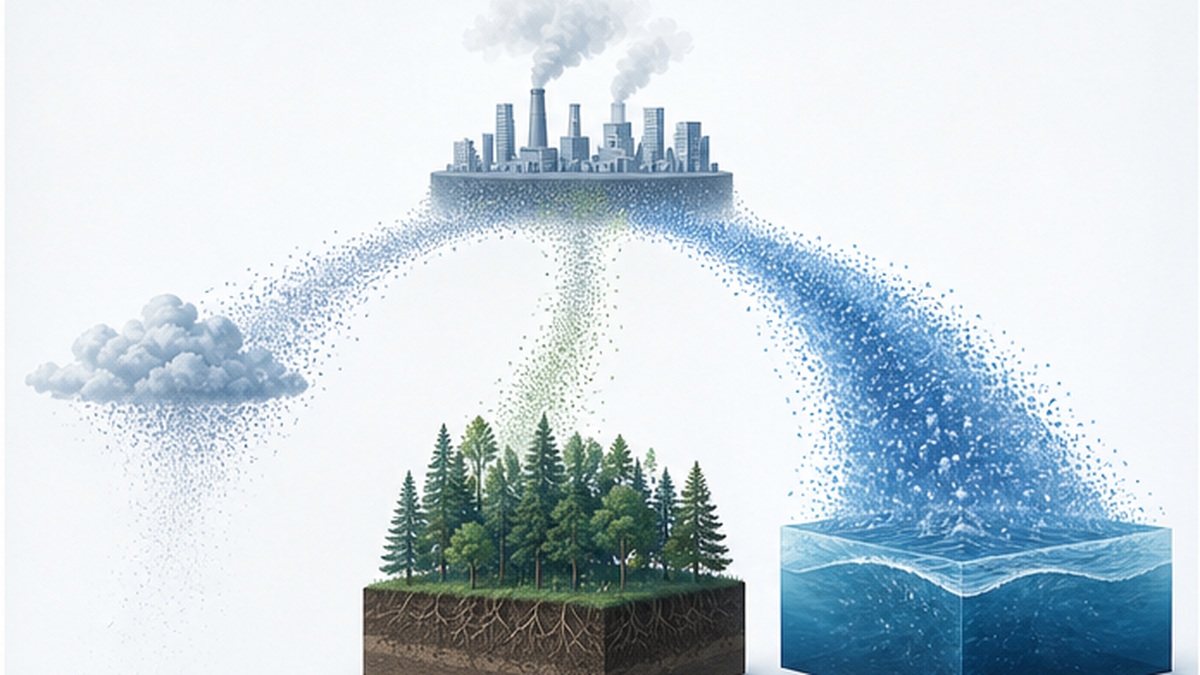
The IPCC's Sixth Assessment Report estimates that the ocean absorbed about 23% of the CO2 emitted by human activity during the 2010s. Looking at the cumulative total since the Industrial Revolution, roughly a quarter has ended up in the sea. On top of that, the ocean has taken up about 91% of the excess heat accumulated in the climate system.
One point matters here: the CO2 the ocean absorbs has not disappeared. It has simply moved from the atmosphere into the sea, and the total amount of carbon on Earth is unchanged. Once inside the ocean it alters seawater chemistry and returns as acidification, a different kind of burden. The ocean has not solved the problem. It has deferred the payment on our behalf.
The ocean's uptake in numbers
According to the Japan Meteorological Agency's Ocean Health Report, global ocean CO2 uptake averaged 2.1 +/- 0.9 billion tonnes of carbon per year between 1990 and 2024. On top of that, rivers deliver a net 0.6 billion tonnes of carbon to the sea each year, so in terms of what the ocean takes directly out of the atmosphere the figure comes to roughly 2.7 billion tonnes of carbon per year. Human CO2 emissions averaged about 10.9 billion tonnes of carbon per year during the 2010s. Divide one by the other and the ocean is absorbing roughly a quarter.
See the primary dataJapan Meteorological Agency, Ocean Health Report: carbon dioxide and ocean acidification dataFreely available observational data on CO2 uptake, long-term surface seawater pH and carbon inventories for the global ocean and the seas around Japan.🔗 data.jma.go.jpIn the 2025 edition of the Global Carbon Budget, published annually by an international research team, the estimate of ocean uptake was revised upward on the basis of new observations and improved process understanding, putting the ocean's share at 29% of total emissions over the past decade. The land sink over the same period took 21%, which makes the ocean sink about 15% larger than the land sink. The fact that these numbers shift between reports is not a sign that one of them is wrong; it reflects a field whose resolution keeps improving.
| Item | Value | Source and period |
|---|---|---|
| Global ocean CO2 uptake | 2.1 +/- 0.9 GtC per year | Japan Meteorological Agency, 1990-2024 average |
| Uptake from the atmosphere including net river input | About 2.7 GtC per year | Japan Meteorological Agency |
| Human CO2 emissions | About 10.9 GtC per year | 2010s average |
| Share absorbed by the ocean (past decade) | 29% | Global Carbon Budget 2025 |
| Share absorbed by land (past decade) | 21% | Global Carbon Budget 2025 |
| Share absorbed by the ocean during the 2010s | About 23% | IPCC Sixth Assessment Report |
A common stumbling block: tonnes of carbon versus tonnes of CO2
- Tonnes of carbon (tC) count only the carbon atoms. Tonnes of CO2 count the whole molecule, including two oxygen atoms.
- To convert, CO2 = carbon x 3.67 (molecular weight 44 divided by 12). So 2.1 GtC is about 7.7 billion tonnes of CO2.
- International climate news tends to use tonnes of CO2, while oceanography and carbon-cycle papers use tonnes of carbon (PgC). The two differ by a factor of 3.67, so it is easy to misread.
- PgC (petagrams of carbon) = GtC (gigatonnes of carbon) = 1 billion tonnes of carbon. Different names for the same quantity.
In some places the flow runs the other way
Saying that the ocean absorbs CO2 describes a global balance sheet. In reality, CO2 enters the sea in some places and leaves it in others. Cold high-latitude waters dissolve CO2 readily and act as strong sinks, while equatorial upwelling regions, where carbon-rich deep water rises to the surface, are net sources. The subpolar North Atlantic and the Southern Ocean are the most important uptake regions on the planet.
These regional signs are not fixed. They shift from year to year with temperature, wind and ocean circulation. When global uptake drops in a given year, identifying the cause means breaking the total down and asking which ocean region did what. The 2023 anomaly described later in this article was uncovered by exactly that kind of decomposition.
The Three Pumps That Draw CO2 Into the Ocean
The machinery that takes CO2 into the sea and keeps it away from the atmosphere can be grouped into three pumps: a physical one, a biological one and a chalky one. Each works in a different place, on a different timescale, and each weakens in a different way.
The solubility pump: cold water carries CO2 into the deep
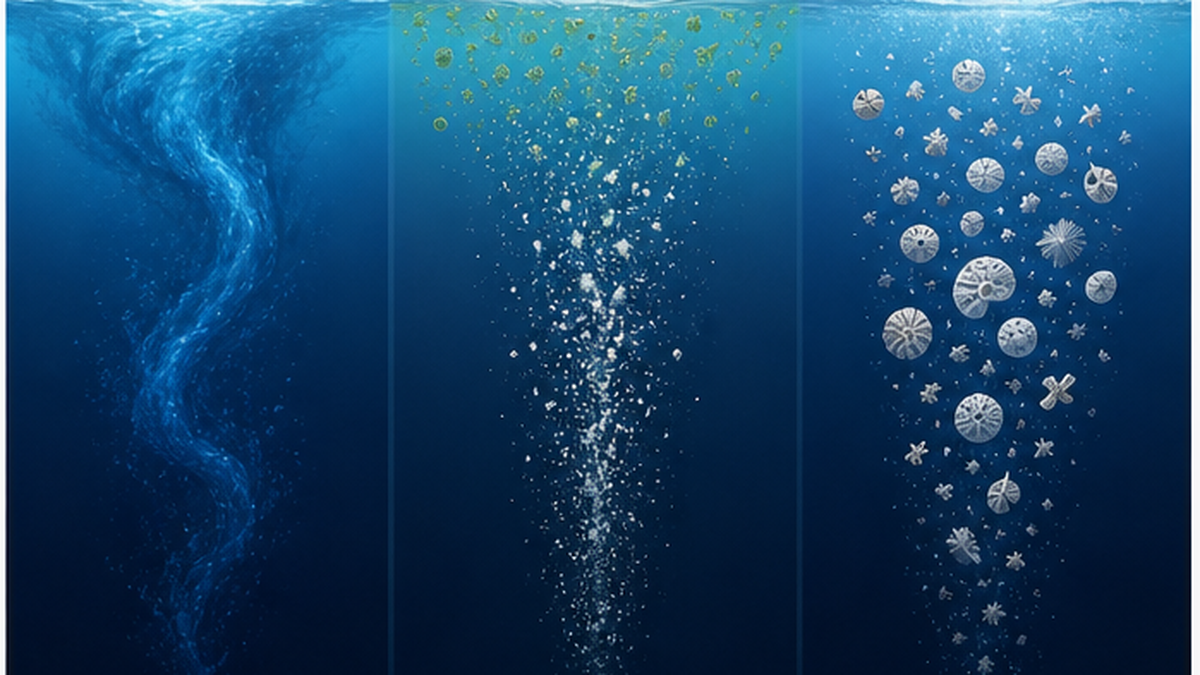
Keep a fizzy drink cold and it holds its bubbles; let it warm up and the gas escapes. That everyday experience is the solubility pump in miniature. CO2 dissolves more readily in colder water, which is why cold high-latitude seas such as the North Atlantic and the Southern Ocean draw down so much of it.
High-latitude water is also cold and, when sea ice forms and expels salt, dense. Dense water sinks into the deep ocean, carrying its dissolved CO2 with it. That deep water then circulates slowly around the world for centuries to more than a thousand years before returning to the surface. In other words, carbon sent downward by the solubility pump is isolated from the atmosphere for far longer than a human lifetime.
The biological pump: marine snow carries carbon downward
In the sunlit surface layer, phytoplankton photosynthesise and convert CO2 into organic matter. Some of it is eaten, and some sinks slowly into the deep as dead cells and faecal pellets, forming the white drifting particles known as marine snow. This is a conveyor belt that moves carbon from the surface to depth.
The total strength of this biological pump is still under active investigation. It was long estimated at around 13 billion tonnes of carbon per year, but a group including JAMSTEC (the Japan Agency for Marine-Earth Science and Technology) evaluated the whole ocean using a method that infers carbon movement from oxygen dynamics and arrived at a smaller figure of about 7.4 billion tonnes of carbon per year. A lower number does not make the biological pump less important, and the same work shows that it matters especially at high latitudes and in the tropics. Phytoplankton are also said to produce roughly half of the oxygen on Earth, and they are decisive as the entry point of the marine carbon cycle.

The carbonate pump: shells, and a slightly awkward complication
The third route runs through coccolithophores, foraminifera, shellfish and other organisms that build shells of calcium carbonate, which then sink and accumulate on the seafloor. Over long timescales this locks carbon into rock, which matters enormously. But the chemical reaction that builds the shell actually increases CO2 in surface water at the moment it happens. So in the short term the carbonate pump is less an aid to uptake than an awkward subtraction from it.
And as ocean acidification advances, building those shells becomes harder. That is a blow to the organisms involved, but viewed purely through the lens of the carbon cycle it also reduces CO2 release at the surface. The ocean carbon cycle does not follow a simple rule in which every bad outcome reduces uptake in the same direction, which is precisely why the numbers deserve careful reading.
The three pumps at a glance
- Solubility pump: the physics of gas dissolving better in cold water, plus deep circulation. Isolates carbon for centuries to a millennium. Vulnerable to warming.
- Biological pump: organic matter formed by photosynthesis sinking as particles. Decades to centuries. Depends on nutrient supply.
- Carbonate pump: calcium carbonate shells sinking and accumulating on the seafloor. Millennia and longer. In the short term it pushes surface CO2 up rather than down.
Uptake Is Not Unlimited: Four Brakes on the Ocean Sink
Now to the heart of the matter. The ocean's capacity to absorb carbon has clear physical and chemical limits, and the awkward part is that most of these brakes press harder as warming advances.
Brake 1: declining chemical buffer capacity, or the Revelle factor
Seawater does not simply dissolve CO2 in water. Dissolved CO2 reacts with water to form carbonic acid, which then converts into bicarbonate and carbonate ions. This chain of chemical equilibria acts as a buffer, and it is the reason the ocean can hold far more CO2 than fresh water could. Had the sea been fresh water, absorbing anything like this quantity would have been impossible.
The strength of that buffering is captured by the Revelle factor, named after Roger Revelle, the oceanographer who pointed early to the ocean's uptake of CO2. The lower the value, the more efficiently the sea absorbs CO2; the higher it is, the harder uptake becomes. Today the value is around 9 in warm low-latitude waters and rises to roughly 15 in the Southern Ocean around Antarctica. Crucially, it is already about one unit higher than before the Industrial Revolution. The more CO2 the ocean absorbs, the further the carbonate system is pushed, the higher the Revelle factor climbs, and the weaker its grip on the next tonne becomes. This is a textbook positive feedback.
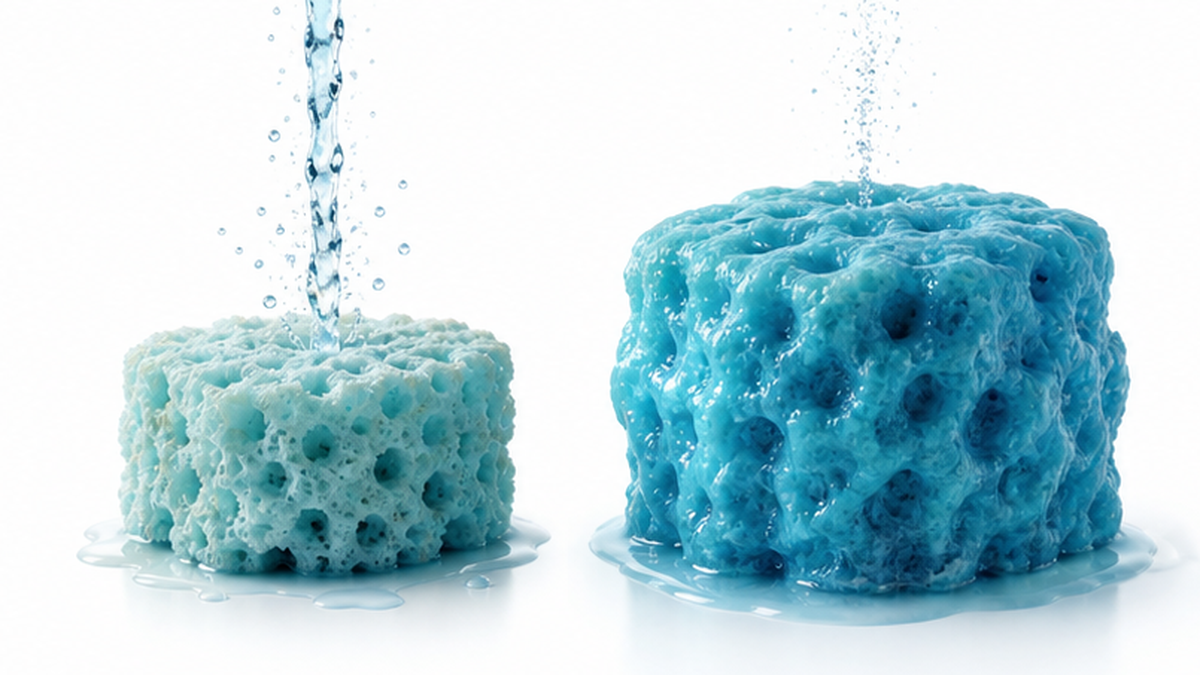
Think of the ocean as a sponge. A dry sponge draws water in eagerly, but the more it holds the more sluggish it becomes. The ocean is nowhere near so saturated that squeezing it would produce water, but the vigour of its uptake is unmistakably fading.
Brake 2: warmer water dissolves less CO2
Back to the fizzy drink. Warm water holds less CO2. As sea surface temperatures rise, the ocean can absorb less at the same atmospheric concentration, and in some places it flips to releasing instead. Warming does not only heat the atmosphere; it directly erodes the ocean's capacity to absorb. The next chapter shows exactly how this played out in observations in 2023.
Brake 3: stratification, when surface and deep water stop mixing
The third brake is easy to overlook and probably the most structural of them all. When surface water warms, or when melting ice freshens it and lowers its salinity, it becomes lighter. Light water sits on top, heavy water below, and the layers separate ever more sharply. That is stratification.
As stratification strengthens, surface water loaded with CO2 struggles to sink. The surface stays full of carbon, never turns over, and eventually loses room to accept anything new. The solubility pump can only keep working if there is a drain into the deep, and that drain is narrowing. Worse, less nutrient reaches the surface from below, so the biological pump loses its fuel too. One phenomenon weakens two pumps at once.
Brake 4: changes to the biological pump
If nutrient supply falls, phytoplankton production falls with it, and so does the amount of organic matter sinking downward. Warmer water is also thought to accelerate microbial breakdown on the way down, so a larger share returns to CO2 before it reaches any depth worth speaking of. What matters for the biological pump is not only how much is produced but how deep it gets, and this remains an area of active research.
| Brake | What happens | Timescale | Relationship to warming |
|---|---|---|---|
| Declining buffer capacity (rising Revelle factor) | Less can be absorbed at the same concentration | Decades onward | Caused by uptake itself (self-amplifying) |
| Falling solubility from warming | Harder to dissolve; some regions flip to release | Immediate to a few years | Direct and strong |
| Stratification | Surface water stops sinking; carbon and nutrient cycling stall | Decades onward | Strong |
| Changes in the biological pump | Less sinking organic matter; shallower remineralisation | Decades onward | Indirect, with large uncertainty |
How to use the word saturation properly
- The ocean has not become a sponge that cannot take another drop. It is still absorbing CO2 on net today.
- The problem is that the efficiency of uptake is falling. For the same emissions, a larger share stays in the atmosphere.
- Saturation therefore appears not as a sudden ceiling but as a gradual loss of efficiency.
- As efficiency falls, the remaining emissions budget compatible with a given temperature target shrinks accordingly.
Signs of Weakening Already Visible
So much for the theory. What do the observations actually show? Over the past few years, a series of reports has suggested that the theory is becoming reality.
Climate change has already shrunk the ocean sink by about 7%
The Global Carbon Budget 2025 estimates that the effects of climate change and climate variability reduced ocean CO2 uptake by about 7% on average over 2015-2024. That is the shortfall relative to what could have been absorbed in the absence of climate change. In the same comparison, the land sink lost about 25%. Land fares worse because it is directly exposed to extremes such as drought and wildfire.
The same report also estimates that 8% of the rise in atmospheric CO2 concentration since 1960 is due to climate change weakening the land and ocean sinks. That number carries weight. Even without any additional emissions on our part, atmospheric concentrations rise simply because the sinks weaken. Warming, in other words, has a circuit built into it that accelerates itself.
The 2023 anomaly: about 10% less uptake than expected
Read the research explainerThe ocean carbon sink is ailing (ETH Zurich)An explanation of the study reporting that ocean CO2 uptake fell about 10% short of expectations during the record-hot conditions of 2023.🔗 ethz.chThe most concrete and most unsettling case is 2023. Partly under a strong El Nino, sea surface temperatures broke records that year. An international team led by Jens Daniel Muller with Nicolas Gruber at ETH Zurich analysed ocean CO2 uptake for that year in detail and published the results in Nature Climate Change in 2025.
Against the uptake expected from historical response patterns, the non-polar global ocean actually absorbed about 10% less. In absolute terms that is roughly one billion tonnes of carbon. As the research institution explained it, that shortfall is equivalent to about half of the European Union's annual emissions. For a single year, it is not a small number.
The cause centred on anomalous CO2 outgassing in the subtropics and subpolar regions, particularly in the Northern Hemisphere. Sea surface temperatures in the North Atlantic became unusually high, solubility fell, and CO2 escaped to the atmosphere from waters that should have been absorbing it. It is a textbook demonstration of Brake 2 in action.

But the ocean also showed resilience
The same paper reports a finding that deserves careful reading. In most regions, the outgassing driven by temperature was partly cancelled out by a depletion of dissolved inorganic carbon (DIC) in the surface mixed layer. As CO2 escaped, the carbon content of the water fell, and that in turn suppressed further release. A negative feedback was at work. It is precisely because of this that the drop in uptake stopped at 10% despite record-breaking heat.
The question is whether this capacity to hold the line persists under sustained warming. Gruber notes that it is unclear whether the compensating mechanisms will remain effective in the long run, and that ocean carbon uptake may decline in the future. 2023 was a year in which both the ocean's underlying strength and its limits became visible at the same time.
The Southern Ocean puzzle: what is happening in a major sink
In the Southern Ocean, one of the largest sinks on the planet, an even more intricate story has been unfolding. Most climate models predicted that its uptake would weaken as warming proceeded. Yet observations since the early 2000s showed it absorbing more than expected. This discrepancy, known as the Southern Ocean carbon anomaly, was debated for years.
A study published in Nature Climate Change in 2025 explained that freshening of the Southern Ocean surface since the 1990s strengthened density stratification, preventing carbon-rich deep water from reaching the surface. In other words, the Southern Ocean's unexpected performance was not raw strength but a temporary damming of its outgassing.
The concern is that surface salinity trends reversed around 2016, and stratification has been weakening across the circumpolar Southern Ocean. If the dam gives way, deep carbon returns to the surface and release could increase. Another group has pointed out that the CO2 partial pressure of water beneath sea ice may have been underestimated, so assessments are moving toward a Southern Ocean sink that is weaker than previously thought and liable to weaken further.
Key points from this chapter
- Climate change has already made the ocean CO2 sink about 7% smaller than it would otherwise be (2015-2024 average).
- 8% of the rise in atmospheric CO2 since 1960 stems from the weakening of the land and ocean sinks.
- In the record-hot year of 2023, the non-polar global ocean absorbed about 10% less than expected.
- The Southern Ocean's unexpectedly strong uptake was probably a temporary effect of stratification, and those conditions have been unravelling since 2016.
Ocean Acidification: The Second Invoice
Because the ocean absorbed so much CO2, atmospheric warming has been considerably restrained. But the bill for that service arrives in the form of altered seawater chemistry. That is ocean acidification.
Global pH is falling by 0.018 per decade
Seawater is naturally slightly alkaline, with a surface pH of about 8.1. When CO2 dissolves and becomes carbonic acid, hydrogen ions increase and pH falls. According to the Japan Meteorological Agency's analysis, global mean surface seawater pH is declining at 0.018 per decade, a drop of about 0.06 over the 34 years since 1990.
A figure of 0.06 looks small, but pH is a logarithmic scale. A drop of 0.1 means hydrogen ion concentration rises by about 26%. Consider that a shift of just 0.1 in human blood pH causes serious physiological consequences, and it becomes easier to imagine what this means for organisms that live in seawater. For the ecological consequences of acidification, and its impact on coral reefs in particular, see The mechanism of ocean acidification and its effects on ecosystems.
Acidification erodes the capacity to absorb
This may be the single most important point in the article. Ocean acidification is not only a matter of harm to marine life. The further acidification proceeds, the weaker the ocean's ability to absorb CO2 becomes.
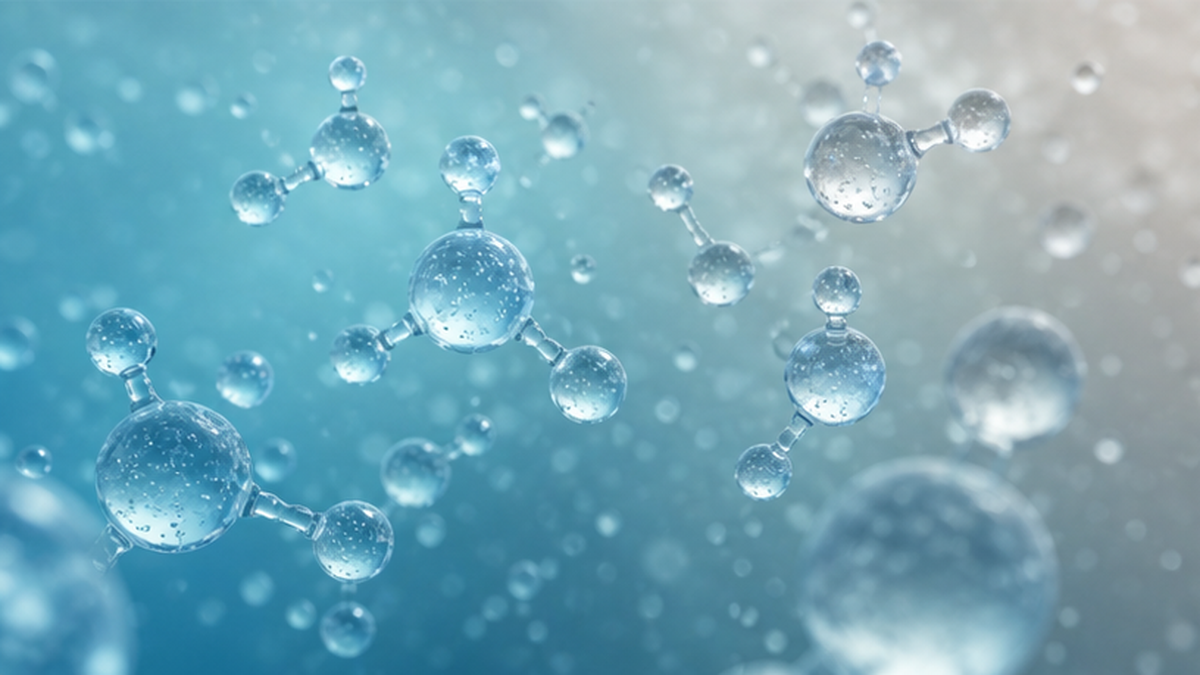
The mechanism runs like this. The hydrogen ions produced when CO2 dissolves combine with carbonate ions, the very species that provided the buffering, and consume them. With fewer carbonate ions, there is less capacity to receive the next dose of CO2. That appears as a rising Revelle factor. The Japan Meteorological Agency likewise states explicitly that advancing acidification reduces the ocean's capacity to absorb carbon dioxide.
In other words, a circuit is running: uptake leads to acidification, acidification reduces the capacity for uptake, more CO2 stays in the atmosphere, and warming intensifies. The ocean keeps absorbing our emissions while using its own strength to erode that same strength.
The reaction from the living side
Acidification hits organisms that build shells and skeletons from calcium carbonate: corals, molluscs, foraminifera, coccolithophores and pteropods. If shells become harder to build, the carbonate pump changes too, and so does the structure of the ecosystem. As noted earlier, a weakening carbonate pump also works in the direction of lowering surface CO2, so the net effect is not easy to evaluate. What is certain is that we are shifting a chemical balance built over centuries in the space of roughly two hundred years.
The advance of ocean acidification has been pointed out as reducing the ocean's capacity to absorb carbon dioxide, and as diminishing the social and economic value of the ocean through negative effects on marine ecosystems.
― Japan Meteorological Agency, Knowledge of Ocean Acidification
What Is Happening in the Seas Around Japan
So far the discussion has been global. But long-term observations have also been accumulating in the waters around Japan, and they capture changes consistent with the worldwide trend.
pH around Japan is also falling by about 0.02 per decade
The Japan Meteorological Agency has maintained decades of oceanographic observations along the 137 degrees east and 165 degrees east lines in the northwestern Pacific. Its analysis shows that surface seawater pH in the seas around Japan is declining by about 0.02 per decade, essentially the same rate as the global mean. Japanese waters are not somehow exempt.
Anthropogenic carbon accumulating down to 1,200 metres
There is a further, more detailed observation. The agency evaluated the accumulation of anthropogenic CO2 in the North Pacific subtropical gyre for the layer from the surface down to a potential density of 27.5 sigma-theta, roughly 1,200 to 1,400 metres deep. Across that region, 147 +/- 34 million tonnes of carbon accumulate per year, which per unit area works out at roughly 3 to 10 tonnes of carbon per square kilometre per year. This region alone accounts for about 20% of the total carbon accumulation in the Pacific.
Carbon absorbed at the surface is genuinely reaching layers more than a thousand metres down and continuing to build up there. That is evidence the solubility pump is still working, and at the same time a record of the fact that the deep ocean's buffer is being consumed little by little.
| Observation | Value | Period and range |
|---|---|---|
| Decline in surface seawater pH around Japan | About 0.02 per decade | Northwestern Pacific, 137E and 165E lines |
| Decline in global surface seawater pH | 0.018 per decade | 1990-2024 |
| Anthropogenic carbon accumulation in the North Pacific subtropical gyre | 147 +/- 34 million tonnes of carbon per year | Surface to about 1,200-1,400 m |
| Accumulation rate per unit area in the same region | About 3-10 tonnes of carbon per square kilometre per year | Around 137E and 165E |
| Share of the Pacific total in that region | About 20% | - |
Marine heatwaves and a warming Japanese sea
The waters around Japan include regions warming faster than the global average. Rising temperature not only lowers CO2 solubility but also strengthens stratification. The abnormally high temperatures reported so often in recent years, known as marine heatwaves, are covered in detail in What is a marine heatwave? These events damage ecosystems, and they also weaken carbon uptake for as long as they last.
News that fish catches are falling because the sea has warmed, and news that the ocean carbon sink is weakening, look like entirely separate stories. In fact they are two views of the same phenomenon.
Slowing the Decline: What Works and What Does Not
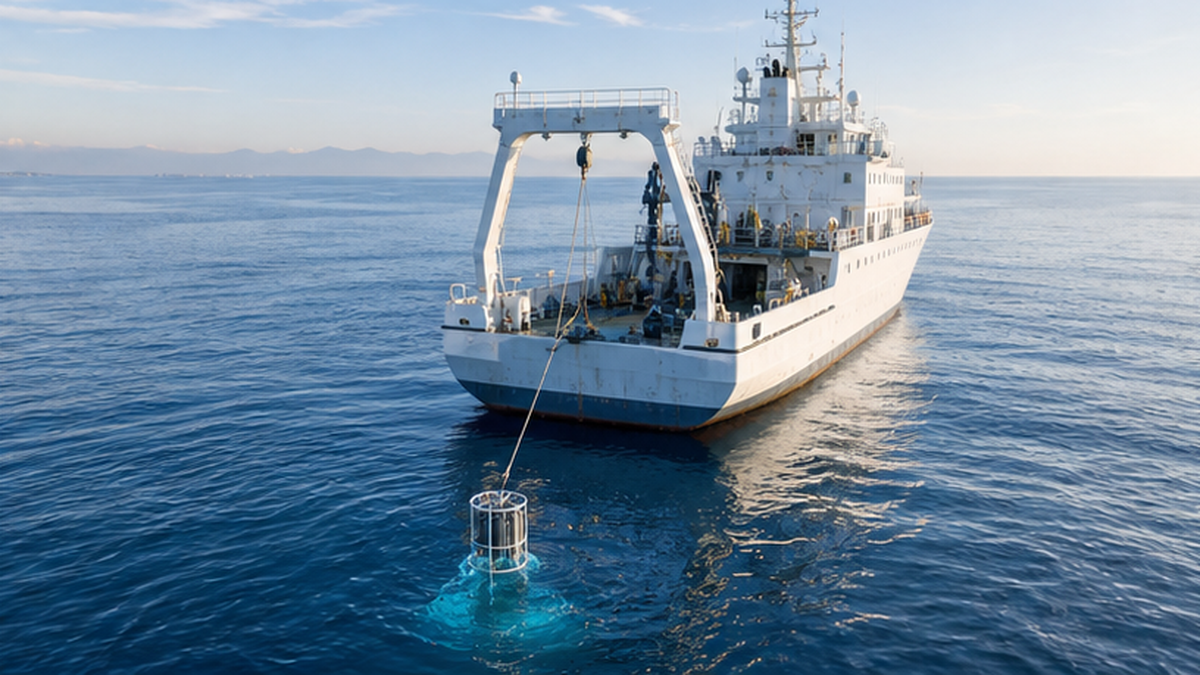
Hearing that the ocean sink is weakening, it is tempting to ask whether we could simply strengthen the ocean. But given the structure of the problem, the measures that work and those that do not are clearly separated. Getting the order right matters.
The root solution is to cut emissions
It is a blunt conclusion, but it comes first. Most of what is weakening the ocean sink is the accumulation of CO2 itself, together with the warming and stratification it produces. Trying to widen the receptacle without turning down the tap is like adding buckets while the water keeps running. And according to the Global Carbon Budget 2025, fossil CO2 emissions in 2025 are projected to reach a record 38.1 billion tonnes. The tap is still open.
There is a second implication worth stating. If uptake efficiency falls, then the remaining emissions budget consistent with a given temperature target becomes smaller than assumed. The margin we believed we had may in fact be shorter.
Blue carbon: what can be protected and expanded at the coast
Increasing carbon uptake in the open ocean by human intervention is not easy, but the coast offers places within reach. Mangrove forests, seagrass meadows, salt marshes and seaweed beds take up carbon and store it in sediment, and that carbon is known as blue carbon. Storage rates per unit area are said to exceed those of terrestrial forests, and the co-benefits are substantial: disaster protection, water purification, and nursery habitat for juvenile fish. For more, see What is blue carbon? How mangroves and seagrass meadows store carbon in the sea.
The scale should be stated honestly, however. Even if every coastal ecosystem in the world were perfectly protected and restored on a large scale, that alone could not offset emissions on the order of 10 billion tonnes of carbon per year. Blue carbon is not a substitute for cutting emissions. It is best understood as work carried out alongside emissions reduction, enriching local seas in the process.

Where marine carbon dioxide removal stands today
In recent years a family of technologies known as marine CDR has attracted attention, aiming to remove CO2 by manipulating ocean chemistry or biology. Representative approaches include ocean alkalinity enhancement, which adds alkaline minerals to restore buffer capacity; ocean fertilisation, which adds nutrients such as iron to boost phytoplankton production; and cultivating large quantities of seaweed to sink into the deep sea.
In principle these are intriguing ideas that could counteract the rising Revelle factor. At present, however, verification methods, ecosystem side effects, costs and international rules are all unsettled. Ocean fertilisation in particular failed to demonstrate the expected carbon sequestration in past experiments and is now tightly regulated internationally over ecosystem risk. These approaches are worth pursuing seriously as research, but this is not the stage at which anyone should treat them as a reason to postpone emissions reduction.
Getting the priorities in the right order
- First priority: cutting CO2 emissions. The only way to address the root cause of the declining ocean sink.
- In parallel: protecting and restoring coastal blue carbon ecosystems. Large co-benefits and comparatively high certainty.
- Research stage: marine CDR. Effectiveness, side effects and governance are unsettled. Not a substitute for emissions cuts.
- Ongoing: long-term ocean observation. Without eyes on the change, we cannot notice an anomaly in the first place.
Reading the Numbers Correctly, and What We Can Do
Finally, some perspective for taking in the news on this topic calmly.
Three things that are easy to misread
- Weakened does not mean it has stopped absorbing. The ocean is still taking up carbon on net, on the order of 2 billion tonnes of carbon per year. What has fallen is efficiency, not function.
- Do not confuse a single year with a long-term trend. Ocean uptake swings considerably from year to year with natural variability such as El Nino. The 2023 shortfall is an important warning, but on its own it does not establish that an irreversible tipping point has been crossed.
- Estimates get revised. The Global Carbon Budget has revised its estimate of ocean uptake upward. Numbers changing is not evidence that the science is wrong; it is evidence that observations and models are being refined.
With all that said, one fact does not change. Whether or not the ocean keeps absorbing, the more CO2 we release into the atmosphere, the more enters the sea and the further acidification advances. The largest variable governing the ocean's future lies not with the ocean but with our emissions.
Realistic first steps, starting today
- Rethink how you use energy: switch your household electricity contract to renewable sources, improve insulation, reconsider how you travel. Individual reductions are small, but shifts in demand move the supply side.
- Look at ocean data yourself: the Japan Meteorological Agency's Ocean Health Report is free for anyone to browse. Seeing long-term changes in temperature and pH around Japan with your own eyes makes the numbers in the news suddenly three-dimensional.
- Join local coastal activities: seagrass restoration, tidal flat conservation, beach cleanups. For many people the blue carbon front line is within reach.
- Talk about what you have learned: the ocean carbon sink is invisible and never sends anyone an invoice, which makes it hard to put on the public agenda. Making it a topic of conversation is itself a countermeasure.

Summary
Summary of this article
- The ocean is the planet's largest carbon sink, having absorbed roughly a quarter of human CO2 emissions since the Industrial Revolution and 29% of emissions over the past decade.
- Uptake is sustained by three mechanisms, the solubility pump, the biological pump and the carbonate pump, and carbon delivered to the deep sea is isolated from the atmosphere for centuries or more.
- But four brakes are tightening as warming advances: declining buffer capacity, falling solubility from higher temperatures, stratification, and changes in the biological pump.
- Climate change has already made the ocean sink about 7% smaller than it would otherwise be, and in the record-hot year of 2023 uptake fell about 10% short of expectations.
- Ocean acidification not only threatens ecosystems but creates a self-amplifying loop that erodes the ocean's very capacity to absorb.
- The fundamental solution is emissions reduction, with conservation and restoration of blue carbon proceeding in parallel, while marine CDR is treated cautiously as a research-stage option.
References and sources
- Japan Meteorological Agency, Ocean Health Report: Ocean CO2 Uptake (Global) – Long-term assessment of global ocean CO2 uptake, averaging 2.1 +/- 0.9 GtC per year for 1990-2024
- Japan Meteorological Agency, Long-term Trend of Surface Seawater pH (Global) – Global mean pH declining 0.018 per decade, about 0.06 since 1990
- Japan Meteorological Agency, Long-term Trend of Surface Seawater pH (Seas Around Japan) – pH around Japan declining about 0.02 per decade
- Japan Meteorological Agency, Carbon Dioxide Inventory in the North Pacific Subtropical Gyre – 147 +/- 34 million tonnes of carbon accumulating annually down to about 1,200-1,400 m
- Japan Meteorological Agency, Knowledge of Ocean Acidification – Statement on the reduction of CO2 uptake capacity through acidification
- IPCC Sixth Assessment Report, Working Group I, Summary for Policymakers – Assessment of ocean CO2 uptake during the 2010s (about 23%) and of the ocean storing about 91% of the excess heat in the climate system
- Global Carbon Budget 2025 FAQ – 29% ocean uptake over the past decade, climate-driven shortfalls of 7% for the ocean and 25% for land, and record fossil emissions of 38.1 billion tonnes in 2025
- Muller et al. (2025), Nature Climate Change – Unexpected decline in the ocean carbon sink under record-high sea surface temperatures in 2023
- ETH Zurich, The ocean carbon sink is ailing – Explanation of the 2023 decline by the research team (Jens Daniel Muller, Nicolas Gruber)
- National Institute for Environmental Studies, Environmental Outlook: The biological pump is 7.4 GtC per year – Whole-ocean evaluation of the biological pump by JAMSTEC and colleagues
* Listed in order of reliability: government/academic institutions > peer-reviewed papers > specialized organizations > reliable media