⚡ In short
Arctic sea ice has shrunk by about 83,000 km² a year since 1979, roughly the area of Hokkaido. This article explains Arctic amplification, Okhotsk Sea drift ice, Japan's winter weather, the Oyashio Current and fisheries, separating what is established from what is still debated.
What happens to Japan's seas and weather when Arctic ice shrinks? Hearing on the news that Arctic sea ice is the "Nth smallest on record" makes the link to daily life hard to see.
The Arctic Ocean has long acted as the planet's cooling system, supporting atmospheric and ocean circulation. As the white ice thins and shrinks, Arctic warming accelerates, and effects on Okhotsk drift ice, the nutrient cycle of the Oyashio Current, and Japan's winter weather have been suggested.
This article first checks the current state of ice loss with observations, then explains why the Arctic warms so fast. It then separates impacts on Japan into what is nearly certain and what is still debated. Unlike our existing articles on ecosystems and Arctic shipping, it focuses on Japan's weather, seas and fisheries.
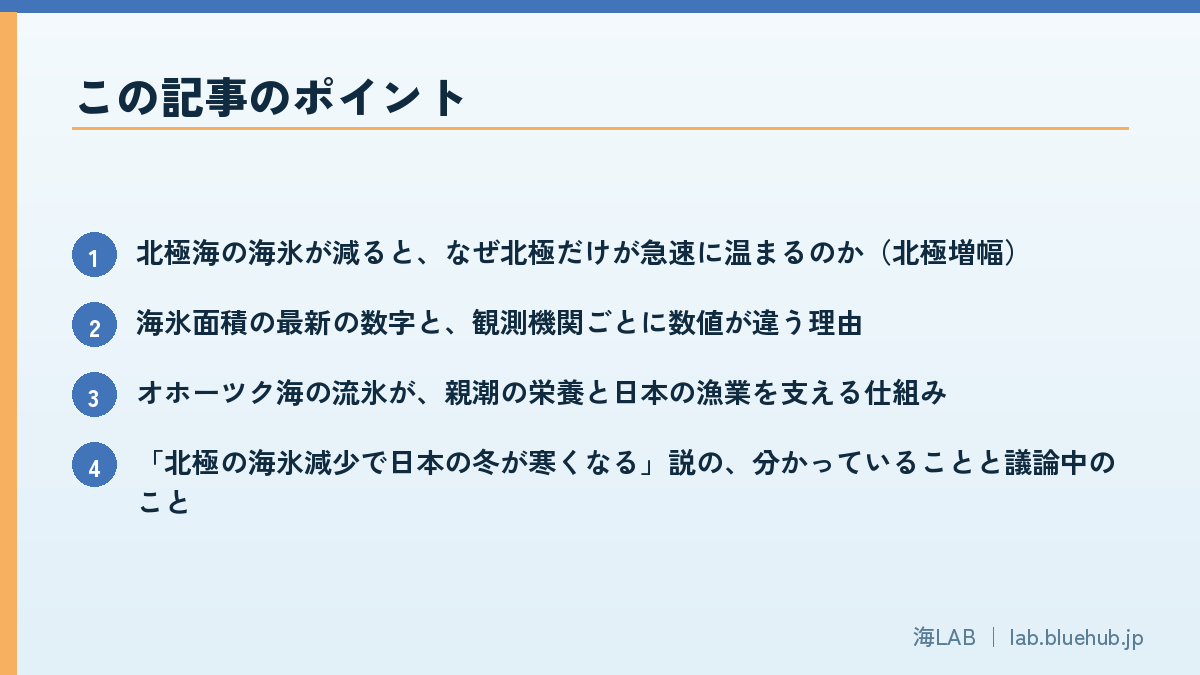
What you will learn in this article
- Why the Arctic warms so fast as sea ice shrinks (Arctic amplification)
- The latest sea ice numbers, and why agencies report different values
- How Okhotsk Sea drift ice supports the Oyashio's nutrients and Japanese fisheries
- What is known and what is still debated about Arctic ice loss and cold winters in Japan
- A way to see the impact of ice loss as a personal matter
What Is Happening to Arctic Sea Ice Now?
About 83,000 km² a year: an area like Hokkaido lost every year
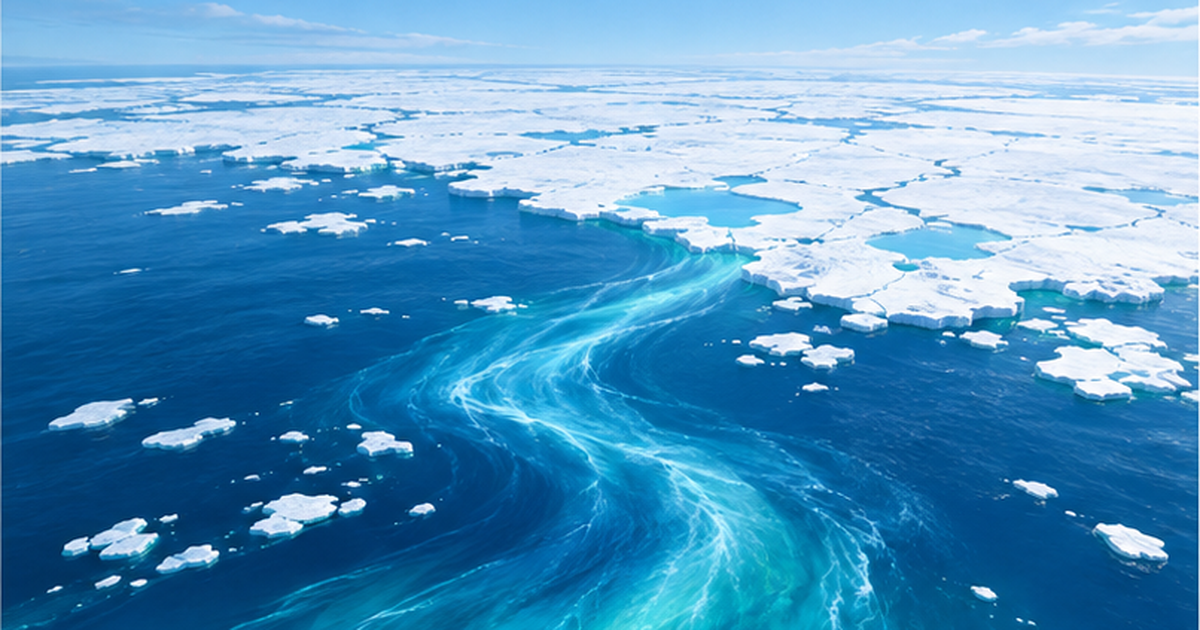
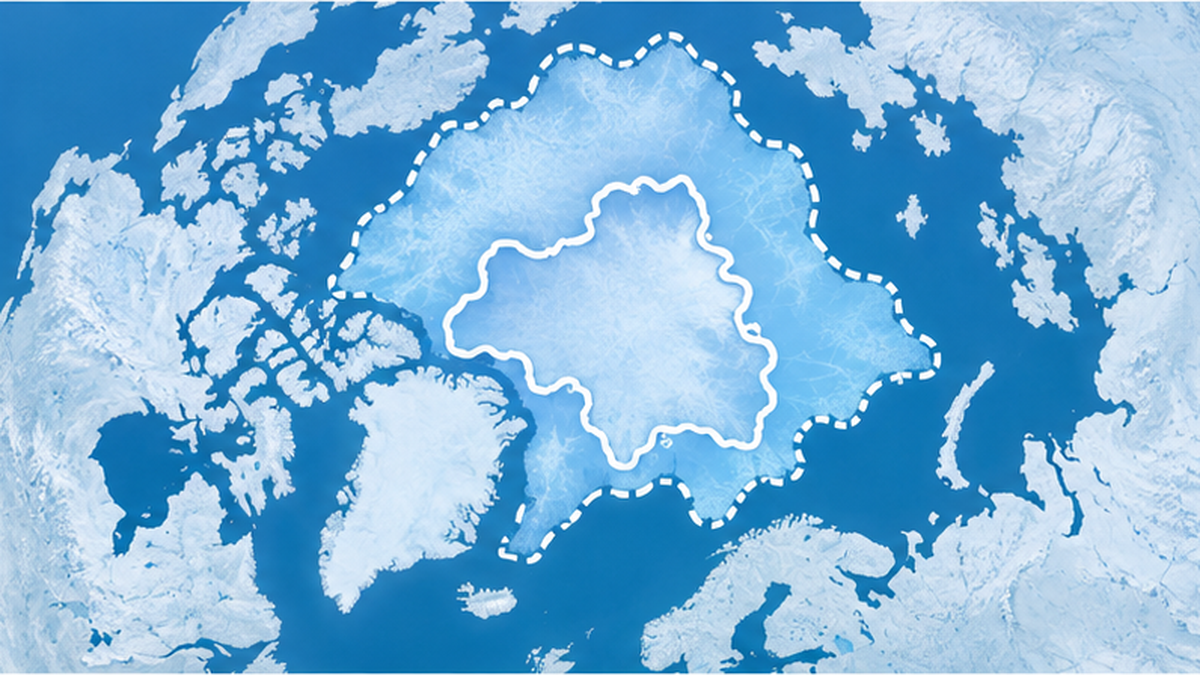
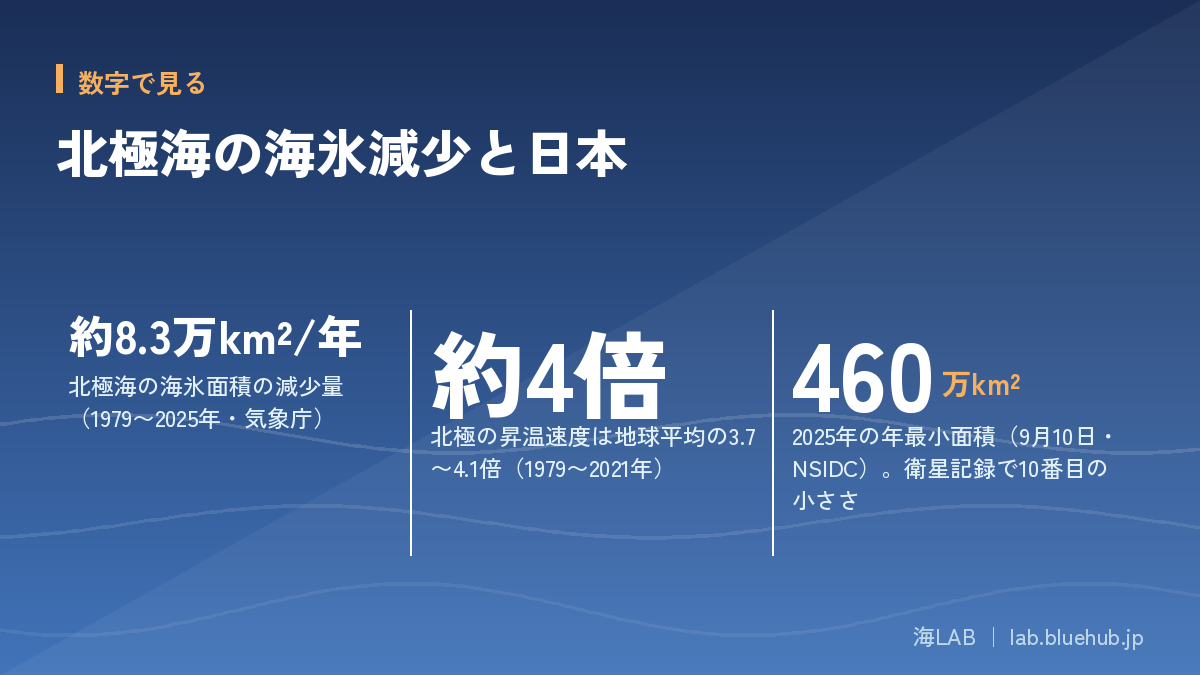
According to the Japan Meteorological Agency (JMA), Arctic sea ice area declined over the long term from 1979 to 2025 at about 83,000 km² per year (95% confidence interval 71,000–94,000 km²), roughly the area of Hokkaido. The decline is especially clear in the annual minimum around September.
Sea ice expands in winter and shrinks in summer. Yet since satellite observations began in 1979, the ice has been smaller each year for the same season. Importantly, thick multi-year ice that survives many summers has decreased while thin first-year ice has increased, and thin ice melts out more easily in summer.
How to read the 2025 record
According to the US National Snow and Ice Data Center (NSIDC), the 2025 minimum was about 4.6 million km² around September 10, the 10th smallest in the 47-year satellite record. The last 19 years hold the 19 smallest minima. Rather than occasional record-low years, a small-ice state has become the norm.
| Indicator | Value | Source / note |
|---|---|---|
| Long-term decline (1979–2025) | ~83,000 km²/yr | JMA; comparable to Hokkaido |
| 2025 annual minimum | ~4.6M km² (Sep 10) | NSIDC; 10th smallest on record |
| 2025 annual maximum (March) | NSIDC: 14.33M km² (Mar 22) / JAXA & NIPR: 13.79M km² (Mar 20) | Values differ by data and method |
Why do agencies report different numbers?
Sea ice area is computed from satellite microwave data as the region above a certain ice concentration. Sensors, thresholds and methods differ, so values for the same day can differ by a few percent. The declining trend is consistent across all datasets. NSIDC also switched to data from AMSR2, aboard a Japanese satellite, in its 2025 processing.
Why the Arctic Warms So Fast: Arctic Amplification
About four times the global average
A 2022 study by Rantanen and colleagues at the Finnish Meteorological Institute reported that from 1979 to 2021 the Arctic warmed 3.7 to 4.1 times faster than the globe, and up to seven times faster around the Barents Sea. This is called Arctic amplification. The study also showed that many climate models fail to fully reproduce the observed rate.
The ratio depends on how the Arctic is defined. Earlier estimates were often 2–3 times, and JAMSTEC materials describe projected Arctic warming of 2.5–3 times. "About four times" is one recent estimate, and depends on definition.
Ice-albedo feedback and heat release from the ocean
One main driver is the ice-albedo feedback. White ice reflects most sunlight, but when it melts, dark water absorbs sunlight, warming the ocean and melting more ice. This positive feedback stores summer heat in the ocean.
In autumn and early winter that heat is released to the atmosphere, so Arctic warming is strongest in late autumn to early winter. Sea ice acts as a lid between ocean and air; when the lid thins, ocean heat passes directly to the atmosphere.
Point: ice is the lid of a refrigerator
- White ice reflects sunlight and cools the sea
- Less ice means the sea absorbs and stores heat
- That heat is released in autumn and winter, accelerating Arctic warming
Okhotsk Sea Drift Ice: The Sea Ice Closest to Japan
Not the Arctic, but under the same climate change
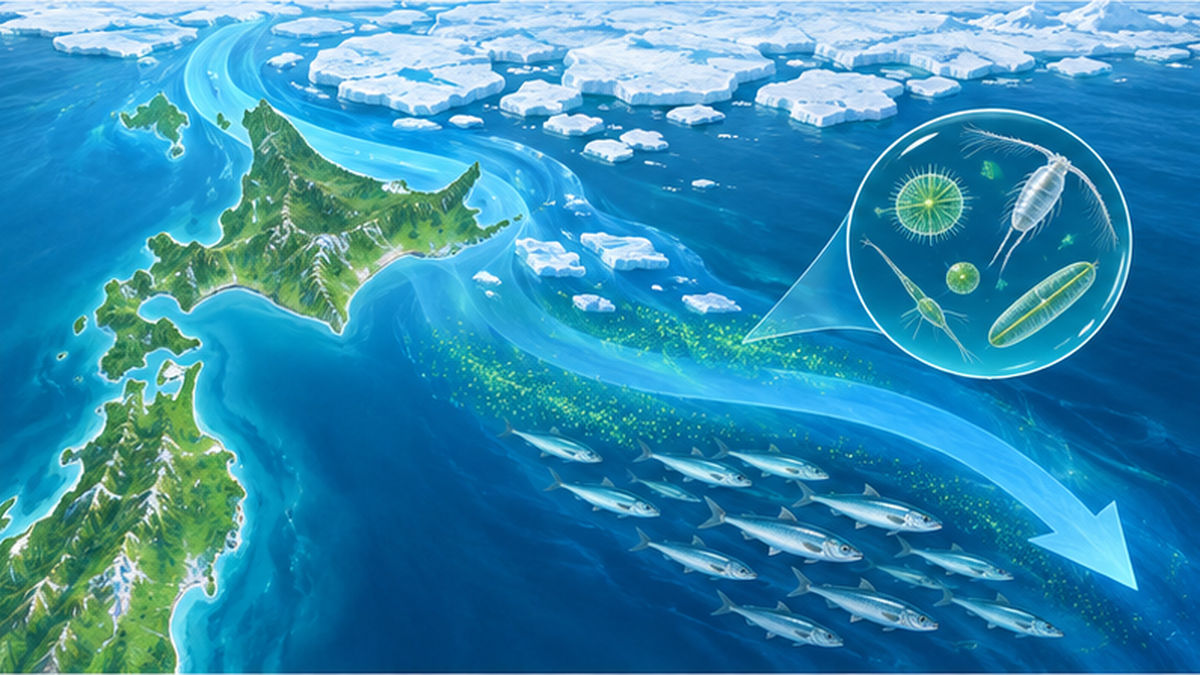
The sea ice closest to Japan is the drift ice reaching the Okhotsk coast of Hokkaido. The Sea of Okhotsk is said to be the lowest-latitude sea in the world where sea ice forms. JMA's diagnosis (as of 2014) showed a decline in maximum sea ice extent of about 60,000 km² per decade, about 3.8% of the whole Sea of Okhotsk.
However, Okhotsk ice is strongly affected by winds and currents, with large decadal natural variability, so caution has been advised before saying it is clearly declining like the Arctic. There is a long-term decline, but year-to-year scatter is large.
Drift ice carries marine nutrients
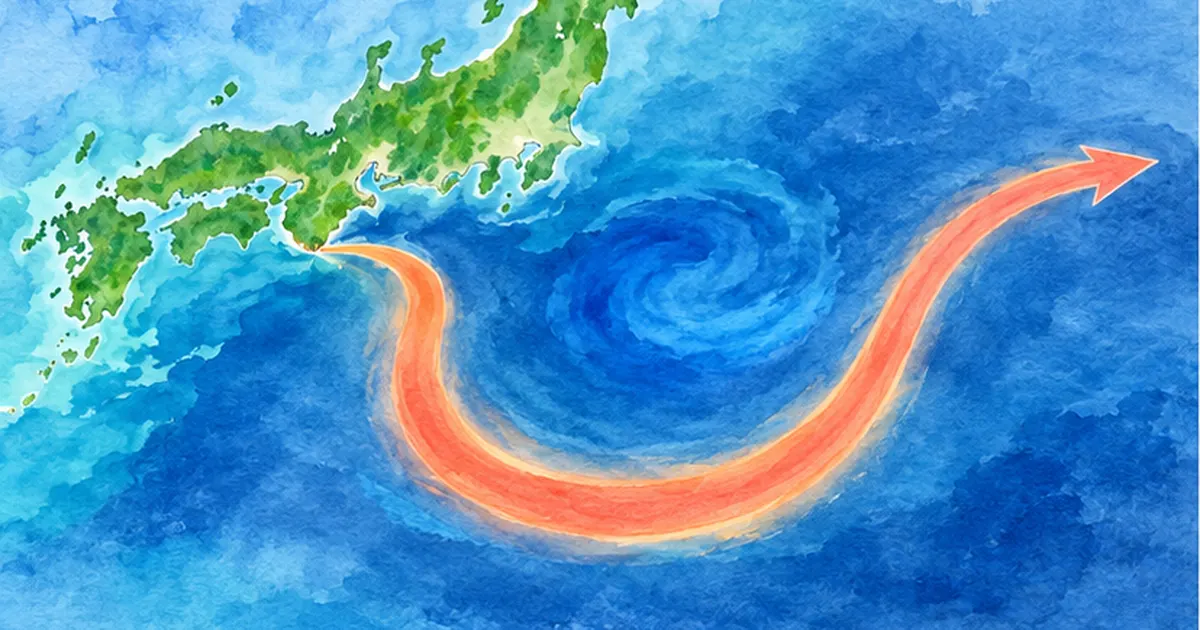
Okhotsk sea ice is not just ice. Ice algae grow in and under it, and when the ice melts in spring it supplies light and nutrients that trigger plankton blooms. Iron carried by rivers such as the Amur is thought to support productivity, and this water flows south as the Oyashio Current, connecting to rich fishing grounds from Hokkaido to off Sanriku.
This does not mean less ice immediately means smaller catches. But if the chain of sea ice, river water and Oyashio changes with climate, the timing and amount of plankton, and the distribution of fish that feed on it, could also change, a topic researchers are watching.
Effects on Japan's Winter Weather: Known and Debated
The idea that less ice means colder winters in Japan
Materials from JMA's Extreme Climate Event Council report that when Siberian-coast sea ice in summer to autumn is low, winters over a wide area of Eurasia tend to be cold, shown by statistical analysis and numerical experiments. The ice loss of summer 2005 was cited as preceding the cold, snowy winter of 2005/06 in Japan.
The proposed pathway is that changes in the Arctic atmosphere due to ice loss strengthen jet stream meandering, letting cold air move south. The Arctic Oscillation and polar vortex have long been known to affect Japan's temperatures.
But causality is not settled
The winter of 2007/08, however, was warm especially in early winter and near normal overall. Climate simulations sometimes fail to reproduce a link between ice loss and cold winters, and researchers disagree. In winter 2015/16 too, Arctic ice was low and the Arctic was generally warm, yet a record cold wave hit East Asia in late January. Even so, a causal link to ice loss has not been asserted.
Caution: do not link them simply
- It cannot be said that years with less ice always have cold winters
- Winter mean temperatures are rising over the long term with global warming
- No single cause explains each cold wave or heavy snowfall
Observations that improve forecasts
JAMSTEC and the National Institute of Polar Research analyzed the February 2015 cold wave that hit Japan and eastern North America and showed that more upper-air observations around the Arctic Ocean capture the initial state of cold air flowing from the Arctic more accurately and improve forecasts. While ice-loss effects are debated, expanding observation itself helps prepare for cold waves and heavy snow.
Effects on Ocean Circulation: Balance of Freshwater and Currents
Sea ice also affects salinity
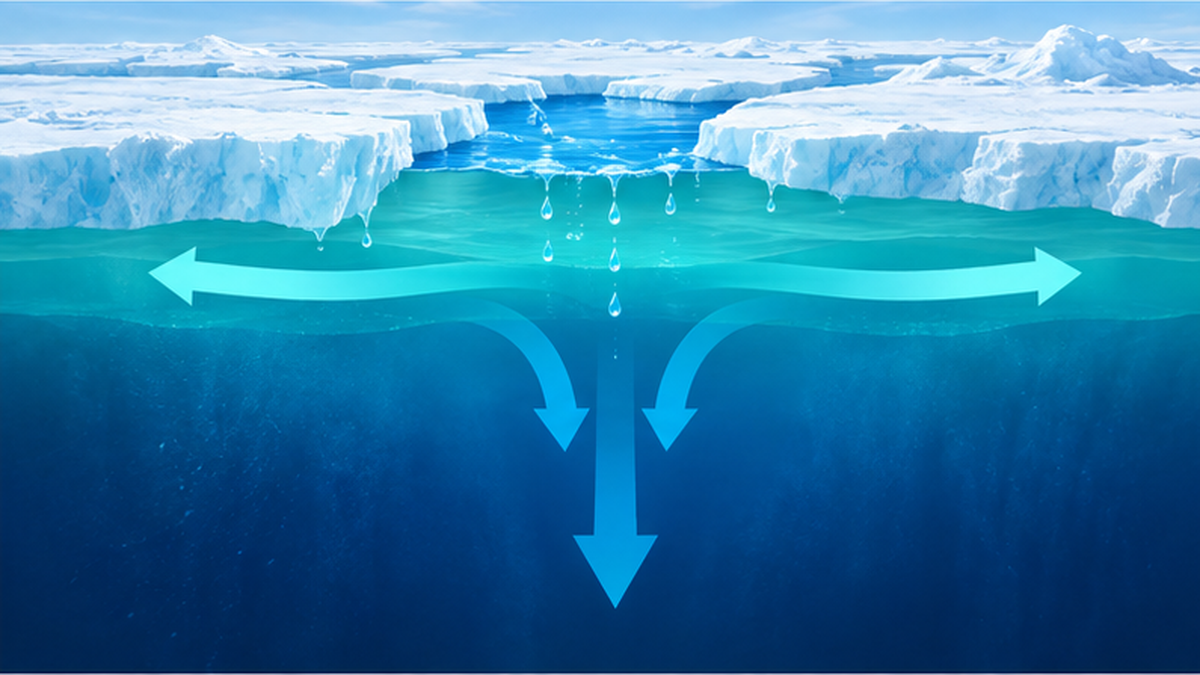
When seawater freezes, most salt is expelled and nearby water becomes cold and dense and sinks. When ice melts, freshwater is added and the surface becomes lighter. In the Arctic, ice change can thus affect vertical ocean circulation through surface salinity and density.
The Atlantic Meridional Overturning Circulation (AMOC) is driven by cold, dense water sinking at high latitudes. As noted in How Warming Seas Change Ocean Currents, weakening of circulation with warming is a key issue for the climate system. How much added Arctic freshwater contributes is assessed differently by models and observations, and research continues.
Links to the Pacific
The Arctic Ocean connects to the Pacific through the Bering Strait. Pacific water flowing into the Arctic carries heat and nutrients, and its influence may grow where ice loss advances. For variability in Japan's Kuroshio, see our article on the Kuroshio large meander. The ocean flows linking the Arctic and Japan are complex and cannot be explained by a single cause.
Effects on Fisheries and Marine Life
Fish moving north and changing fishing grounds
Sea ice loss and warming push fish distributions toward higher latitudes. Northward shifts have been reported in the Bering and Barents Seas. For details, see Impacts of Arctic Sea Ice Loss on Ecosystems and Fisheries.
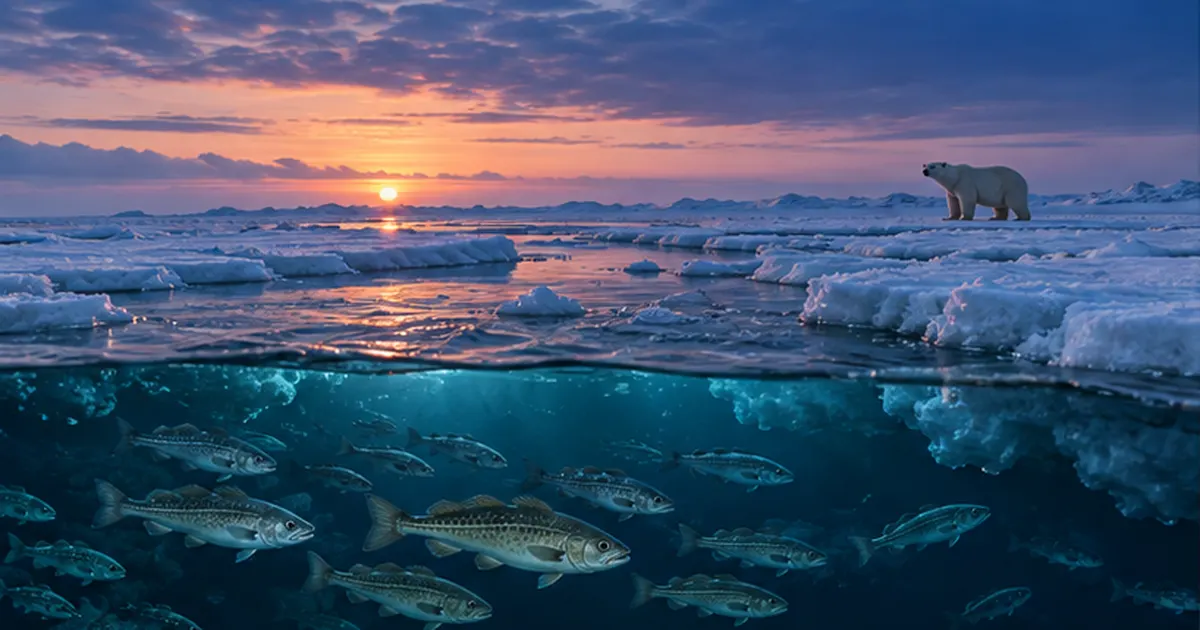
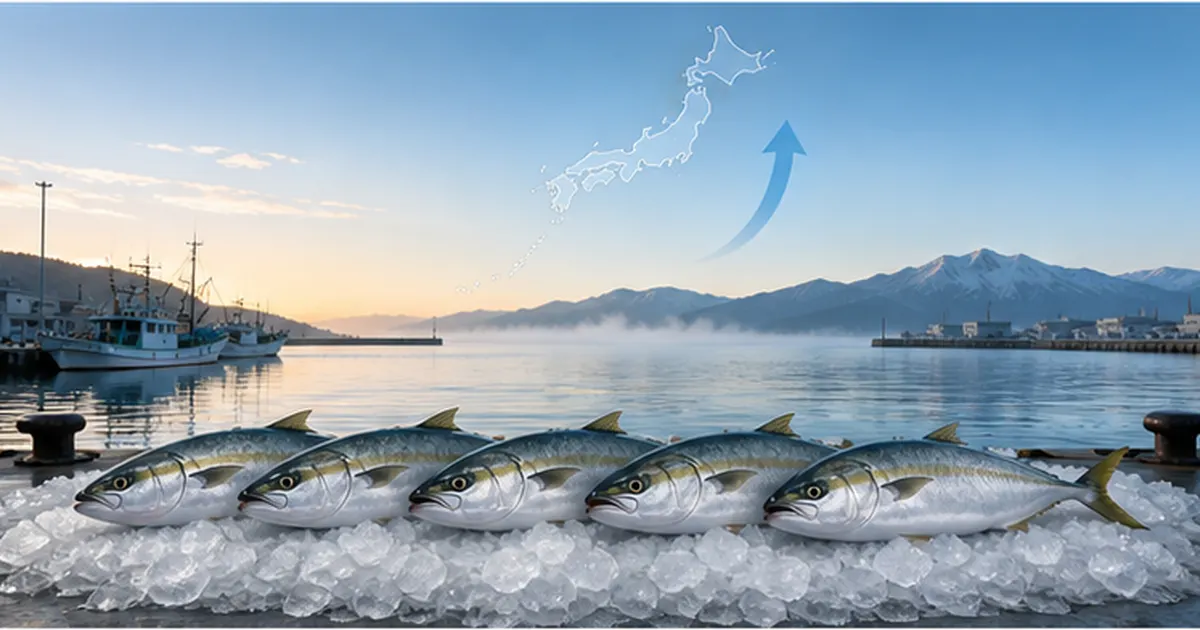
For Japan's fisheries, changes in temperature and nutrients in Oyashio-influenced waters matter more than Arctic fishing grounds themselves. Key northern resources such as Pacific saury, walleye pollock and salmon are strongly influenced by the Oyashio, so catches could change as the ocean changes. But overfishing and natural variability also play roles, and sea ice loss alone cannot be named as the cause of any stock's rise or fall.
Overlap with marine heatwaves
Arctic warming proceeds by different mechanisms from marine heatwaves and warming around Japan, but overlapping changes place compound stress on marine life. Read together with our article on marine heatwave impacts for a fuller picture.
| Pathway of impact | Certainty | Relevance to Japan |
|---|---|---|
| Arctic warming (amplification) | Clearly observed | Indirect effects on global climate |
| Okhotsk Sea ice change | Long-term decline (large year-to-year variation) | Nutrient environment of Oyashio and northern fishing grounds |
| Link to winter cold waves and heavy snow | Still debated | Winter forecasting, disaster prevention |
| Effects on ocean circulation (e.g., AMOC) | Assessments differ | Long-term climate and ocean conditions |
Arctic Shipping and International Rules: A Changing Northern Sea
Less ice lets ships through
As ice declines, the period in summer to autumn when ships can use Arctic routes is lengthening. Because the Asia–Europe distance can be shortened, shipping interest is growing, and Japan is also interested, for example for resource transport.
But expanded routes bring new environmental loads such as ship emissions, oil spill risk and noise affecting marine life. Ice loss, a bad change, may open the door to further pressure. For permafrost thaw and methane, see Arctic Permafrost Thaw and Methane Release.
Supported by international scientific cooperation
The Arctic Ocean is surrounded by the coasts of several nations, and international cooperation in observation and research is essential. Japan has contributed through polar research, ocean research vessels and satellite observation. Continuous data underpin climate prediction.
What We Can Do: Know, Reduce, Prepare
The root is cutting greenhouse gases
The most reliable way to slow Arctic ice loss is to cut greenhouse gas emissions. Choosing energy saving and renewables, rethinking transport, and reducing food loss may look small but add up to society-wide reductions.
Pay attention to changes in the sea
News such as the September minimum extent and the first and last days of drift ice each winter are familiar indicators of climate change. Checking data published by JMA and others reveals the changes behind the numbers.
What you can do today
- Check the latest Arctic and Okhotsk ice extent on JMA's sea ice pages
- Review household energy use and choose energy saving and renewables
- Use ocean news as a starting point to talk with family and friends
- Pay attention to changes in seasonal seafood and where it comes from
Summary
- Arctic sea ice is declining by about 83,000 km² a year, and a small-ice state has become the norm
- The Arctic is warming about four times faster than the global average, and ice loss accelerates it
- Okhotsk drift ice supports Oyashio nutrients, but variation is large and assessment should be cautious
- Effects on Japan's winter weather are still debated, so do not link them simply
- Continued observation and emission cuts are the basic stance toward uncertainty
Clearing Up Common Misunderstandings
"Melting Arctic ice raises sea level" is only half right
Melting of floating sea ice changes volume very little and hardly contributes directly to sea level rise (the same principle as ice floating in a glass of water). Sea level rise is mainly from melting land glaciers and ice sheets and thermal expansion of seawater. Sea ice loss matters not for sea level but because less reflected sunlight accelerates warming, and for effects on ecosystems and weather.
"Ice increased this year, so warming has stopped" is wrong
Sea ice area varies from year to year and may recover slightly for a few years. What matters is the decades-long trend. Over the period since 1979 the decline is clear. Avoid drawing conclusions from one or two years and judge by long-term trends.
参考文献・出典
- JMA: Long-term trend of Arctic sea ice area – Decline 1979–2025 (~83,000 km²/yr)
- JMA: Long-term trend of Okhotsk Sea ice area (2014 edition) – Trend in maximum ice extent
- JMA: Climate Change Monitoring Report 2025 (Chapter 10) – Ocean and polar changes
- CIRES / NSIDC: Arctic sea ice has reached minimum extent 2025 – 2025 annual minimum
- University of Eastern Finland: Warming in the Arctic region has been four times faster than the global average – Explainer on Rantanen et al. 2022
- Rantanen et al. (2022) The Arctic has warmed nearly four times faster than the globe since 1979 – Communications Earth & Environment
- JMA: Extreme Climate Event Council regular meeting materials – Arctic sea ice and Eurasian winter temperature
- JAMSTEC: Upper-air observation around the Arctic Ocean and cold wave prediction (2016 press release) – Improved prediction of cold air outbreaks
- JST Science Portal: Arctic warming and its impact on Japan – Research news
* Listed in order of reliability: government and academic institutions > peer-reviewed papers > specialist organizations > trusted media