⚡ The answer in 30 seconds
- The AMOC is very likely to weaken during the 21st century, but there is medium confidence that no abrupt collapse occurs before 2100 (IPCC AR6).
- Direct observations cover only about 20 years, so telling a long-term decline from natural variability remains unresolved.
- Studies from 2023–2025 split into those suggesting collapse may be near and those suggesting it is unlikely.
- "Collapse in 2025" is a misreading: 2025 is only the start of a 2025–2095 range.
The AMOC (Atlantic Meridional Overturning Circulation), a giant current system running the length of the Atlantic, underpins Europe's climate and the global distribution of heat. News that it may "stop" keeps recurring, yet researchers' views are sharply divided.
As a sequel to the basics article Why Is the AMOC Weakening?, this article focuses on the research frontier: observation, projection and early-warning signals.
Drawing on IPCC reports and major peer-reviewed papers from 2018–2025, we have tried to describe as neutrally as possible what is known and what is not.
What You Will Learn in This Article
- How the AMOC works and what the unit Sv means
- What observing systems such as RAPID and OSNAP actually measure
- Why IPCC AR6 distinguishes "slowdown" from "collapse"
- Why studies from 2023–2025 seem to reach opposite conclusions
- The idea behind early-warning signals (critical slowing down and freshwater transport)
- Three viewpoints for reading "collapse" headlines
What Is the AMOC? A Giant Ocean Conveyor Running Through the Atlantic
The Basic Structure of the AMOC and the Unit "Sverdrup"
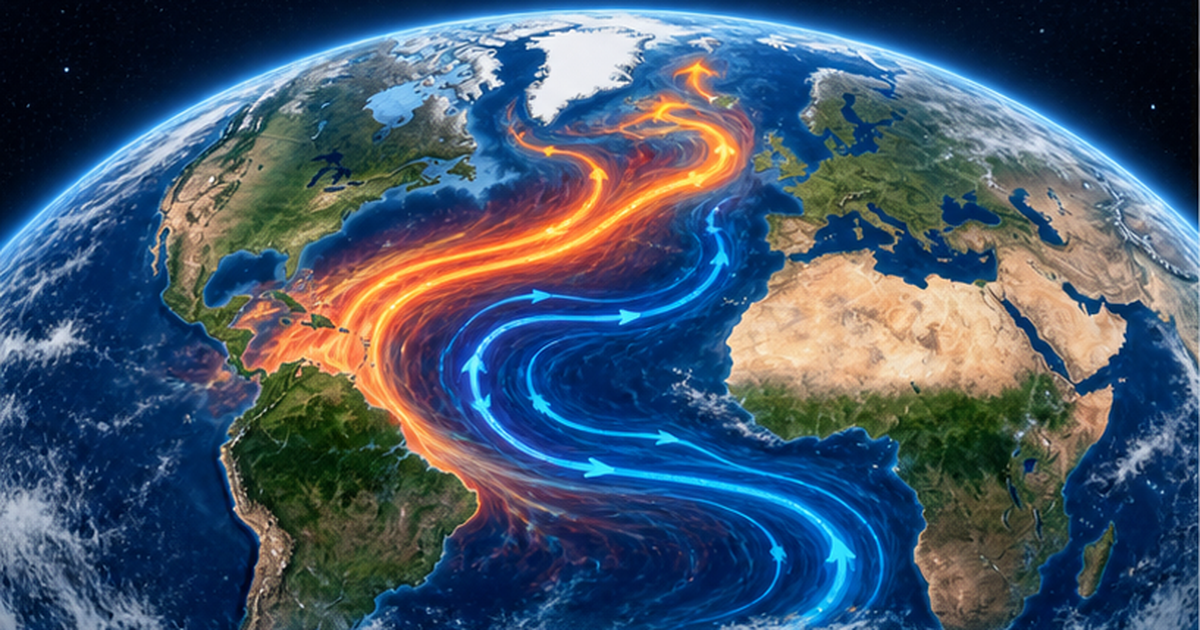
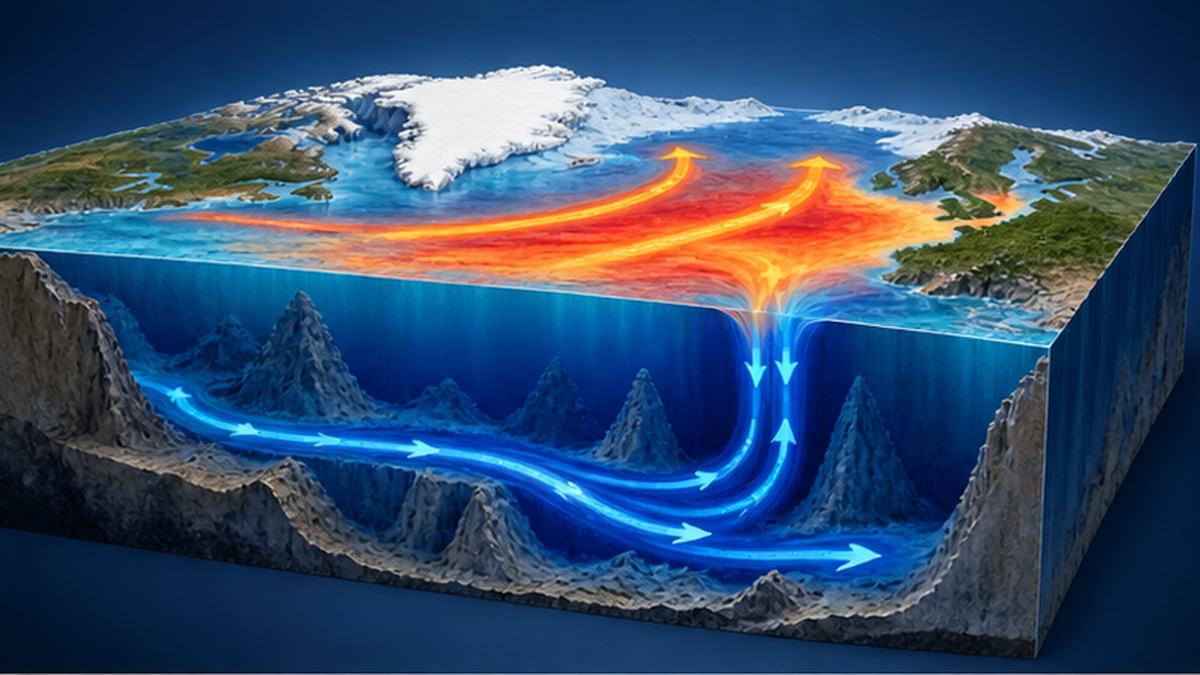
The AMOC (Atlantic Meridional Overturning Circulation) is a huge north–south circulation in which warm water flows north at the surface of the Atlantic and cold water returns south at depth. The Gulf Stream is part of its upper limb, carrying tropical heat to the North Atlantic and supporting the mild climate of northwestern Europe.
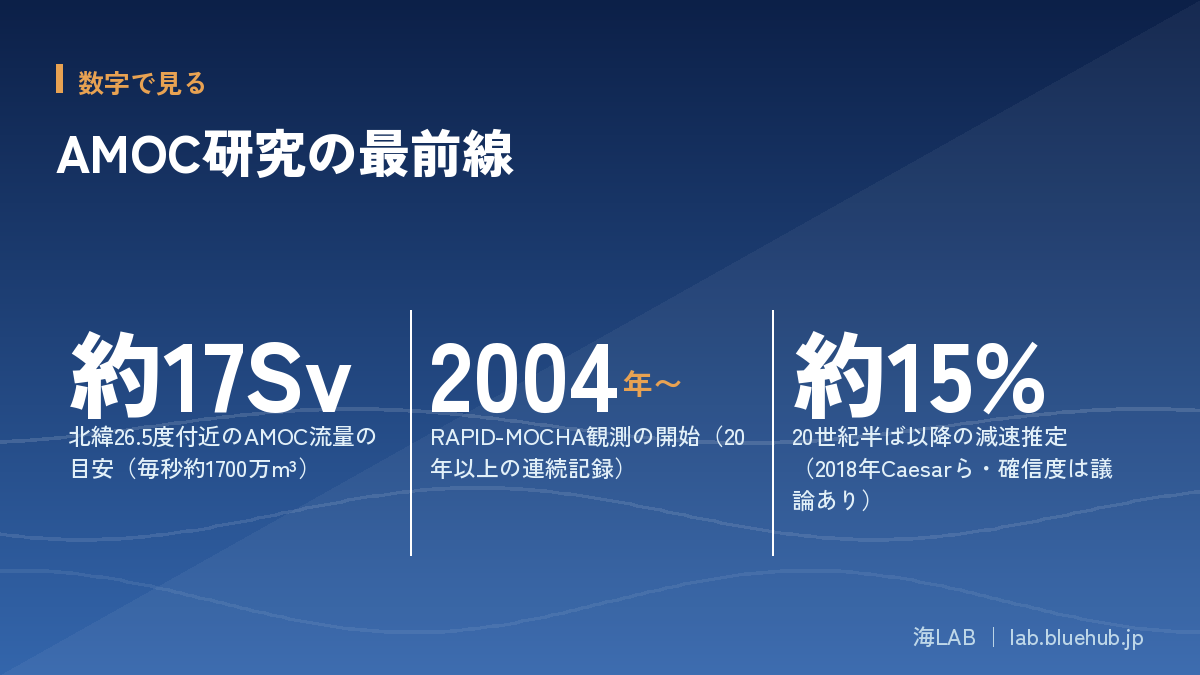
Its flow is expressed in Sverdrups (Sv), where 1 Sv is one million cubic meters per second. The AMOC near 26.5°N averages about 17 Sv, equal to more than ten times the combined flow of all the world's rivers. Keeping this number in mind helps you grasp the scale of studies reporting declines of a certain number of Sv.
Is It Driven by Wind or by Density?
The AMOC is sometimes equated with the "thermohaline circulation" (circulation driven by density differences), but strictly they are not the same. Not only the sinking of deep water but also upwelling driven by the westerlies over the Southern Ocean helps sustain the whole circulation. With the growing understanding that both wind and density drive it, thinking about the AMOC's future now requires looking at changes in Southern Hemisphere winds as well as freshwater in the North Atlantic.
Recent research therefore treats the exchange of water among the North Atlantic, South Atlantic, Southern Ocean, and the Indian and Pacific Oceans together, aiming to understand "the AMOC as part of global ocean circulation." This view also connects to the 2025 study by Baker et al. mentioned later.
How Much Heat Does the AMOC Carry?
The AMOC delivers to the North Atlantic an amount of heat that the climate system cannot ignore. Thanks to this heat transport, North Atlantic coasts are milder than North Pacific coasts at the same latitude. The gentle winters of northern Europe and Britain are often cited as a benefit, but atmospheric westerlies and topography matter greatly too, so the AMOC alone does not explain them. This is why saying "Europe would freeze if the AMOC stopped" is considered an oversimplification.
Why Does Water Sink in the North Atlantic?
Warm water flowing north is cooled around Greenland and in the Labrador Sea, becomes heavy and sinks to depth. This is the "pump" that drives the whole system. For sinking to occur, the water must be salty (dense) enough, so if the surface is diluted by meltwater from ice sheets or more precipitation, the pump could weaken.
This article is a sequel to our existing article, "Why Is the AMOC Weakening?", which covers the basics of thermohaline circulation and compares it with the movie. Here we focus on the research frontier: how it is measured, how it is projected, and what is still unknown.
Glossary
- AMOC = north–south circulation of the Atlantic / Sv (Sverdrup) = unit of flow (1 Sv = one million m³/s) / Tipping point = a threshold beyond which a change becomes hard to reverse
How Is It Measured? The Evolution of RAPID, OSNAP and Other Observing Networks
The RAPID-MOCHA Array at 26.5°N
The leading system for directly measuring the AMOC is the RAPID-MOCHA array at 26.5°N, begun in 2004. Instruments moored on the seafloor across the Atlantic continuously record temperature, salinity and current speed, from which the north–south transport across the whole section is calculated. It is a valuable continuous record now exceeding 20 years.
Still, the record covers only a few decades. Because the AMOC has natural fluctuations from year to year and decade to decade, it is not easy to tell whether a 20-year trend reflects a long-term slowdown or just natural variability.
Fluctuations Seen in the Observations
The RAPID record shows that the AMOC varies considerably by season and by year. In the winter of 2009–2010, a sharp drop over a short period was observed, and its possible effect on North Atlantic weather was debated. Because short changes of one or two years are not unusual, it is risky to declare a "long-term slowdown" from a few years of data.
As more networks were added, differences by latitude also emerged. The subtropics (26.5°) and the subpolar region (OSNAP) differ in the size and causes of variability, and the very assumption that "the AMOC can be described by a single number" is being revisited. Studies continue on flow by latitude and on the vertical structure of density.
The Role of Satellites and Argo Floats
Filling gaps in direct observation are about 4,000 Argo floats deployed across the world's oceans and satellite observations. Floats measure temperature and salinity by depth, while satellites measure sea-surface height and salinity. They do not measure "the AMOC itself," but they are important for monitoring the density structure and heat distribution that result from it.
What OSNAP Revealed: A Surprise About Where Water Sinks
In 2014, the OSNAP observations began across the subpolar North Atlantic. A 2019 study (Lozier et al., Science) showed that the main sites forming deep water are not the Labrador Sea, as long believed, but eastern regions such as the Irminger Sea and the Iceland Basin. This result prompted a reconsideration of model assumptions.
| Network | Start | Location | What it reveals |
|---|---|---|---|
| RAPID-MOCHA | 2004 | 26.5°N (subtropics) | Changes over time in the north–south transport across the Atlantic |
| OSNAP | 2014 | Subpolar North Atlantic | Where and how much deep water is formed |
| SAMBA (South Atlantic) | From around 2009 | Around 34.5°S | Freshwater transport at the southern boundary (an early-warning candidate) |
Limits of observation: The ocean is vast and deep, and no network can capture the whole AMOC at once. At present, results from several networks are combined and complemented with models.
Tracing the Past "Fingerprints": Claims of Slowdown from Proxy Indicators
Estimating from Sea-Surface Temperature Patterns
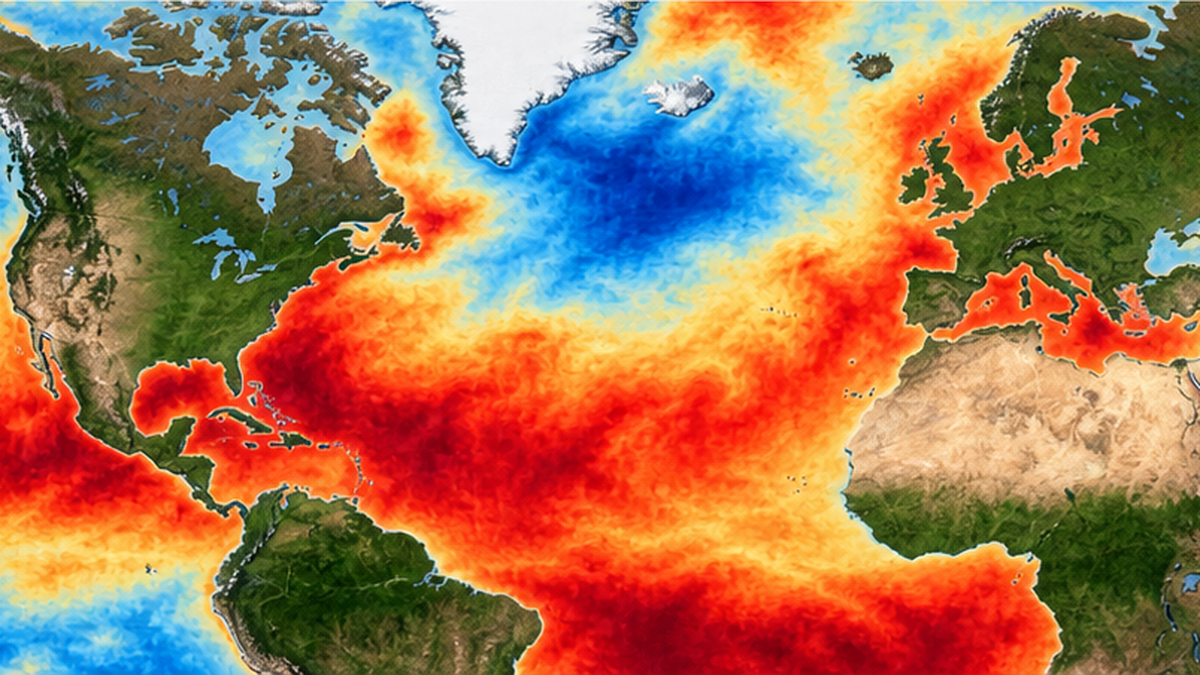
Because direct observations are short, researchers use long-term proxies. A 2018 study by Caesar et al. in Nature used the sea-surface temperature pattern of a "cold blob" in the North Atlantic surrounded by warming as a fingerprint of the AMOC, and estimated that the AMOC weakened by about 15% since the mid-20th century. A 2021 follow-up (Nature Geoscience) concluded that it is in its weakest state in more than 1,000 years.
A Cautious View: Does the Fingerprint Reflect Only the AMOC?
On the other hand, sea-surface temperature is also affected by changes in aerosols and natural atmospheric variability. The IPCC Sixth Assessment Report (AR6) assigned low confidence to a 20th-century AMOC decline, an assessment that honestly acknowledges the limits in the quality and length of observational data.
Another approach is to use patterns of change in ocean heat content. If the AMOC weakens, heat accumulation in the mid-latitude North Atlantic is expected to follow an unusual pattern, and studies compare this with reanalysis data of actual heat content. However, such reanalysis data also have large uncertainties in periods with sparse observations.
Going further back, proxies in deep-sea sediments (e.g., the 231Pa/230Th ratio and benthic foraminiferal isotopes) indirectly indicate AMOC strength. Several research groups using such paleoclimate methods have reported that the present AMOC is on the weak side of the past 1,000 years. Challenges remain, however, in regional representativeness and dating accuracy.
Lessons from "Fingerprint" Research
The strength of the fingerprint method is that it gives a long perspective beyond the observation period. Its weakness is the difficulty of attributing one cause when several factors overlap. With both in mind, researchers use cautious wording: "there are several lines of evidence for a slowdown, but they are not conclusive." Readers, too, need to judge how solid a finding really is.
- Supporting side: sea-surface temperature fingerprints, changes in salinity and heat transport, and the consistent trends of several independent proxies
- Cautious side: the observation period is short and hard to separate from natural variability, and the indicators are affected by other factors
- Common ground: it cannot be said with certainty either that it "has definitely slowed" or that it "has not slowed"—this is the honest state of knowledge
Will Collapse Happen? Model Projections and the "Too-Stable Models" Problem
IPCC AR6 Assessment: Slowdown Is Likely, but an Abrupt Collapse...
AR6 states that the AMOC is very likely to weaken during the 21st century in all emission scenarios, while there is medium confidence that no abrupt collapse will occur before 2100. It is important to read "weakening" and "stopping" separately.
Most climate models (CMIP6) show a decline of the AMOC during the 21st century. A 2020 study (Weijer et al.) comparing multiple models indicated a possible decrease of 6–8 Sv (about 34–45%) by the end of the century. This, however, is a "major slowdown," not a "collapse."
Do Models Overestimate Stability?
A long-debated question among researchers is whether models portray the AMOC as more stable than reality. If the way freshwater enters and salinity biases are poorly reproduced, tipping points can look farther away than they are.
In February 2024, van Westen et al. published a paper in Science Advances. In an experiment of about 4,400 model years, in which a climate model (CESM) was fed freshwater gradually, they reproduced an actual AMOC collapse and proposed that the freshwater transport by the AMOC at the southern edge of the Atlantic (around 34°S) could serve as a precursor. The paper can be read as saying that the real AMOC is heading toward a tipping point, but it gives no specific year.
In 2025, a modeling study by Baker et al. also appeared in Nature, showing that stabilizing mechanisms in the Southern Ocean and the Pacific make the AMOC unlikely to collapse even if it weakens this century. In reality, conclusions differ greatly from paper to paper.
Model Resolution and the Treatment of Freshwater
One challenge for climate models is resolution. If the fine-scale flows (eddies) created by the Gulf Stream and seafloor topography are not well represented, the locations of sinking and the mixing of freshwater are shifted. High-resolution models have in some cases shown a larger AMOC slowdown than low-resolution ones. As computing power grows, future projections may change.
Another issue is the treatment of Greenland ice-sheet meltwater. Many CMIP6 models do not input meltwater from ice sheets as it occurs in reality. It has been pointed out that accounting for accelerated melting could strengthen the AMOC slowdown, which further widens the range of model projections.
A "Range of Projections" Is Not a Weakness of Science
- Projections do not converge on one answer not because research is inadequate, but because the system is complex and depends on future emissions and the pace of ice-sheet melt. The range itself is valuable information when thinking about risk.
"Collapse in 2025" Is a Misunderstanding
- The 2023 study by Ditlevsen and Ditlevsen (Nature Communications) estimated the timing of collapse as a range of "2025–2095" based on sea-surface temperatures from 1870–2020; 2025 is only the beginning of that range. News reports simplified it to "collapse in 2025," but the researchers themselves said the uncertainty is large.

What Are Early-Warning Signals? Finding the "Approach" to a Tipping Point
Critical Slowing Down: Larger Fluctuations, Slower Recovery
Complex systems near a tipping point show "critical slowing down," recovering more slowly from small disturbances. In time series this appears as increasing variance (size of fluctuations) and increasing autocorrelation (similarity to previous values). The study by Ditlevsen and Ditlevsen looked for this statistical sign in long sea-surface temperature records.
The weakness of this method is its strong dependence on the quality and length of data. Sea-surface temperature is only a "stand-in" for the AMOC, and noise from other factors can produce false positives that look like warning signs even when no tipping point is near. Critical researchers have pointed this out strongly.
The idea of critical slowing down is a general framework that has also been used in other fields, such as lake eutrophication and abrupt ecosystem change. When applied to the AMOC, results depend on "which variable, over what period, at what resolution," so the method of analysis itself is debated. Researchers repeatedly test whether the same conclusion is obtained from multiple datasets and methods.
A Physics-Based Indicator: The Idea of Freshwater Transport
In contrast to statistical signs, what van Westen et al. presented is a "physics-based" indicator. The idea is that if the amount of freshwater carried by the AMOC in the South Atlantic changes in a certain direction, the AMOC's self-reinforcement (positive feedback) fails and collapse becomes more likely. The AMOC maintains its own sinking by carrying salty water north.
For the physics-based indicator too, observations of actual freshwater transport in the South Atlantic are limited. Networks such as SAMBA are gradually accumulating data, but longer continuous observations are needed to judge a tipping point. We are at the stage of "an indicator has been found, but it is not yet measured well enough."
| Approach | Data used | Strength | Weakness |
|---|---|---|---|
| Statistical signs (critical slowing down) | Long records such as sea-surface temperature | Can be tried with observational data alone | Risk of false positives from a stand-in indicator |
| Physics-based indicator | Observations of South Atlantic freshwater transport | Can be explained from the mechanism | Lack of long direct observations |
| Model experiments | Reproduction by climate models | Can follow the course of collapse in detail | Doubts about model stability |
Combine the Three Methods
- No single method yields a conclusion. The basic stance of current research is to check whether statistics, physics and models point in the same direction.
Abrupt Changes in the Past: Dansgaard–Oeschger Events and the Younger Dryas
The Climate When the AMOC Actually Changed
The importance of the AMOC is also known from records of past climate change. During the Younger Dryas, from about 12,900 to about 11,700 years ago, the warming Northern Hemisphere cooled again, as recorded in Greenland ice cores and lake-bed pollen. One factor long debated is that meltwater from the North American ice sheet flowed into the Atlantic and weakened the AMOC.
During the glacial period, "Dansgaard–Oeschger events," in which temperature changed by several degrees within decades, also appeared repeatedly. The strength of the AMOC is thought to have been involved in such abrupt changes too. However, today's Earth differs from that time in the scale of ice sheets and climate conditions, so note that the past will not simply repeat itself.
What the Past Records Teach Us
- Depending on conditions, the AMOC can change abruptly on timescales of decades (it does not always change slowly)
- On the other hand, the triggers and timescales differ by era, making it hard to apply the past directly to the present
- Paleoclimate data are one of the few clues for testing the stability of models
The fact that it "has happened before" is still used in researchers' discussions as grounds for not fully ruling out future possibilities.
Clues from Ice Cores and Seafloor Sediments
Greenland ice cores record temperature changes of more than ten degrees within decades. In seafloor sediments, there are traces of iceberg-derived debris (Heinrich layers) deposited when the AMOC weakened. Together, these have been treated as evidence of a chain: "freshwater input → AMOC slowdown → Northern Hemisphere cooling."
Research continues on the details of the mechanism and sequence. The past records are consulted not as a prediction of a glacial "return" but as a lesson that the AMOC can have a strong influence on climate.
If a Tipping Point Is Crossed: Expected Impacts and Links to Japan
Effects on Europe and Tropical Rainfall
Model experiments show that if the AMOC weakens greatly or stops, effects include cooling around the North Atlantic, a southward shift of the tropical rain belt, and sea-level rise along North Atlantic coasts. In the experiment of van Westen et al., drastic cooling in Europe and a shift of the tropical rain belt after collapse were also confirmed. However, because global warming itself continues at the same time, it does not simply mean "Europe turns into an ice age."
What It Means for Japan
The Atlantic circulation may seem distant, but the atmosphere and ocean are connected worldwide. Through changes in Northern Hemisphere atmospheric circulation and the westerlies, it could affect Japan's weather indirectly. For the meandering of the westerlies, see Why Does the Meandering Jet Stream Cause Extreme Weather?. How much AMOC variability affects Japan's weather, however, is still a field of ongoing research.
Along coasts, it has also been pointed out that AMOC changes could affect sea level. A weaker AMOC is said to tend to raise sea level along the North American east coast for dynamical reasons, which matters for coastal-city adaptation. For countermeasures, see Climate Change Adaptation for Coastal Cities.
Impacts on ecosystems cannot be ignored either. Phytoplankton in the North Atlantic depend on nutrients supplied by circulation. If circulation changes, primary production may change and affect even fishery resources. Here too, most studies are still at the stage of "possibilities have been pointed out," and quantitative assessment is ongoing.
Deep circulation also carries atmospheric CO2 into the deep sea, so a change in circulation could change the ocean's carbon uptake. See also What Percentage of Human CO2 Does the Ocean Absorb?.
| Area of impact | Tendency shown in research | Level of confidence |
|---|---|---|
| Temperature around the North Atlantic | A weaker AMOC exerts a cooling force | Relatively consistent |
| Tropical rain belt | Shifts so the north becomes drier and the south wetter | Differs between models |
| Sea level on Atlantic coasts | Possible local rise through dynamical effects | Under study |
| Impact on Japan | Possible indirect effects through atmospheric circulation | Much is still unknown |
No Sudden Ice Age Like in the Movie
- Even if the Atlantic circulation changes, the change is thought to proceed over decades to centuries, not years. Things will not freeze over in a few days as in the movie.
Research Challenges: What Is Still Unknown and What Observations Are Needed
Five Main Unresolved Questions
- Short observation period: Direct observations cover about 20 years, making it hard to separate multi-decadal variability from a long-term slowdown
- Where the freshwater goes: Understanding is insufficient of where Greenland meltwater actually spreads and how it affects sinking
- Model bias: Whether poor reproduction of salinity distribution leads to overestimating stability
- Relation to other ocean regions: How strongly the stabilizing mechanisms of the Southern Ocean and the Pacific actually work
- Reliability of stand-in indicators: Whether the AMOC can truly be reconstructed from sea-surface temperature
Efforts That Will Matter Going Forward
Researchers are strengthening South Atlantic observations, using the Argo float network that measures ocean salinity, observing sea-surface salinity and height from satellites, and comparing paleoclimate data with models. Maintaining international observing networks for decades will determine the accuracy of future projections.
It is not appropriate to take divided research as "so we can relax," nor to conclude "so it is dangerous." The basic scientific stance is that uncertainty itself is a subject of risk management.
There is also a role for us in supporting research. Marine education for citizens and public lectures and data release by research institutions play an important role in connecting science and society. For a distant-sea topic like the AMOC, it is especially important to share correct information together with appropriate uncertainty.
How to Face Uncertainty: What We Can Do
Reading the News: Three Points to Check
- Distinguish "collapse" from "slowdown": Check what the word "collapse" in a headline refers to in the study
- Check the range of timing: See whether "2025" or "2050" is a point or the edge of a range
- Peer-reviewed paper or commentary?: Make a habit of going to primary sources (papers, IPCC reports)
Cutting Greenhouse Gases Is the Surest Measure
Whatever the AMOC's future, curbing warming is the most direct way to limit ice-sheet melt and freshwater input. Research on tipping points is moving toward making the question "how far must emissions fall to be safe?" more concrete.
What You Can Do Today
- (1) Check the latest information from reliable sources (IPCC, the Japan Meteorological Agency, ocean research institutions) / (2) Work on cutting CO2 at home and work / (3) Take an interest in citizen science, donations and education that support ocean observation and research
Summary
- AMOC research is in a process where longer observations, the discovery of physics-based indicators and model improvements are advancing at once, and conclusions are divided. What can be said with certainty is that a slowdown is likely, but the timing of any abrupt collapse is unknown.
References and Sources
- IPCC Sixth Assessment Report, Working Group I (The Physical Science Basis) – AMOC assessment (Chapter 9)
- RAPID-MOCHA Observing Program (UK National Oceanography Centre) – Observing array at 26.5°N
- OSNAP(Overturning in the Subpolar North Atlantic Program) – Observations in the subpolar North Atlantic
- van Westen et al. (2024) Science Advances – Physics-based early warning signal shows that AMOC is on tipping course
- Ditlevsen & Ditlevsen (2023) Nature Communications – Warning of a forthcoming collapse of the AMOC
- Caesar et al. (2018) Nature – Observed fingerprint of a weakening AMOC
- Caesar et al. (2021) Nature Geoscience – Current Atlantic Meridional Overturning Circulation weakest in last millennium
- Lozier et al. (2019) Science – A sea change in our view of overturning in the subpolar North Atlantic
- Baker et al. (2025) Nature – Continued Atlantic overturning circulation even under climate extremes
- Japan Meteorological Agency: Ocean Health Check-up – Explanations of ocean and climate change
Ordered by reliability: government/academic institutions > peer-reviewed papers > specialized organizations > reputable media