⚡ The answer in 30 seconds
- Fish spoils fast and faces standard and recognition barriers, so loss arises easily at markets and retail.
- Japan's food loss was 4.72M t in FY2022, and the 2.36M t business-sector figure met the FY2030 target early.
- Official seafood-only statistics are scarce, and global estimates range from 14.8% to about 35% by source.
- Keeping it cold, using it up, connecting it, and how buyers choose are the keys to reducing loss.
Fish spoils faster than most foods and varies widely in size and shape. As a result, fish that could have been eaten are lost little by little at markets and retail stores.
Official figures for seafood alone are scarce. This article sorts out the numbers that can be confirmed from primary sources, separates what is known from what is not, and explains how the losses arise and how they can be reduced.
Sources include the Ministry of Agriculture, Forestry and Fisheries (MAFF), the FAO and the World Economic Forum (WEF). The figures are estimates, and the scope differs by source.
What you will learn
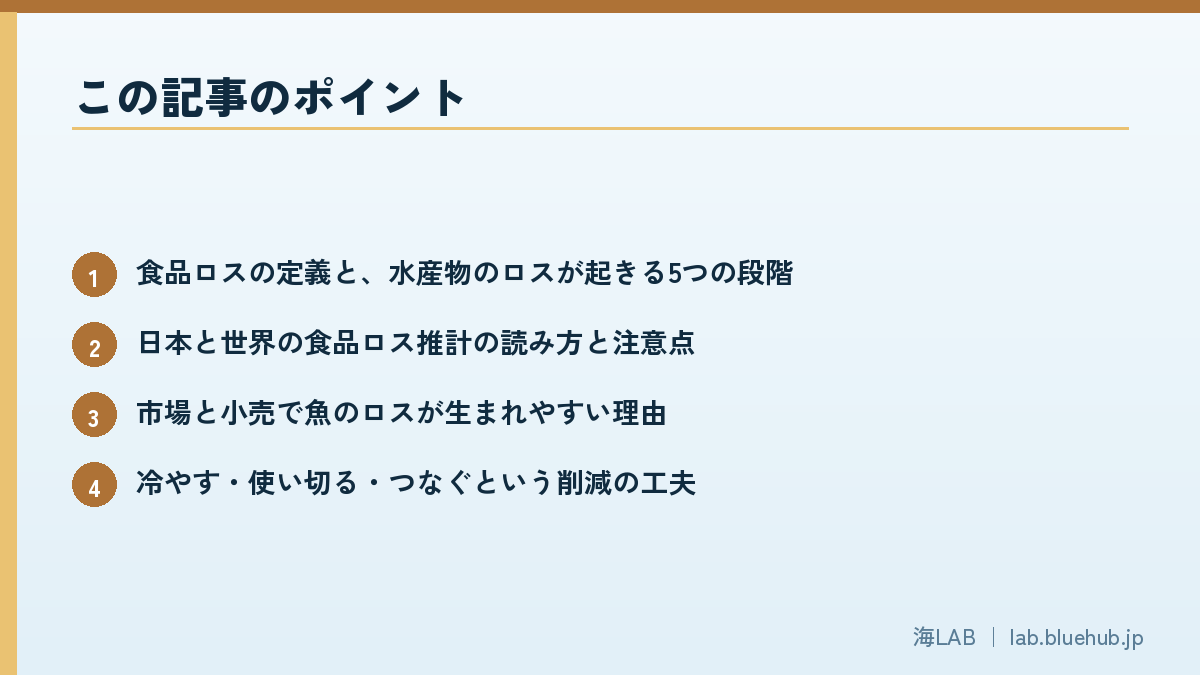
- How food loss is defined, and the five stages where seafood is lost
- How to read Japanese and global food loss estimates, and their caveats
- Why fish loss arises at markets and retailers
- Ways to cut loss: keep it cold, use it up, connect it to buyers
- What you can do when buying and eating
At which stages does seafood food loss occur?
Food loss and the FAO definition
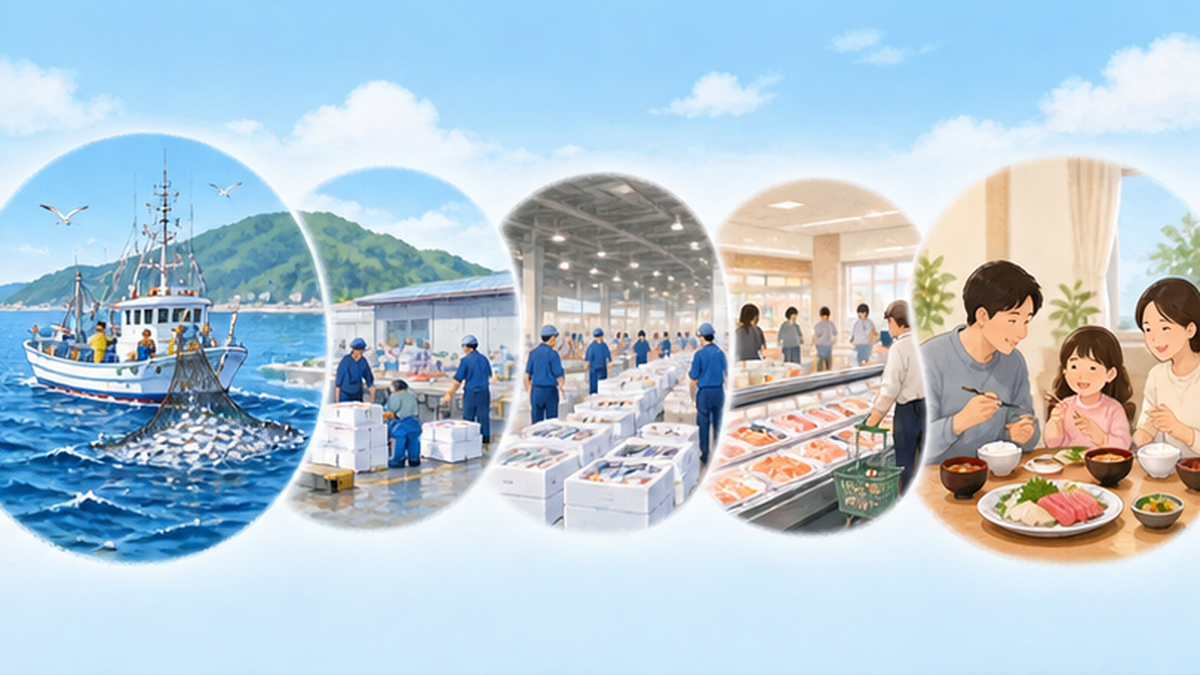
Fish spoils quickly and varies greatly in weight and shape. Because of this, edible fish is lost at many points between the catch and the table. The Food and Agriculture Organization of the United Nations (FAO) defines food loss and waste as "a decrease in the quantity or quality of food." It is common to call what happens from production up to just before retail "loss," and what happens at retail, food service and consumer stages "waste."
As an example from fisheries, the FAO cites discards: bycatch thrown back at sea. Fish lost before reaching land also counts as part of seafood loss.
Five checkpoints from catch to table
- Catch and on board: bycatch, undersized fish, failures of temperature control on the vessel
- Landing and origin market: fish with no price, damage during handling
- Wholesale and intermediate wholesale (consumer-side market): unsold, off-standard or less fresh fish
- Retail and food service: unsold goods, discarded clearance items, over-preparation
- Households: overbuying, leftovers, cooking scraps
This article focuses on markets (wholesale) and retail. For households, see our article on household food loss; for the overall picture of seafood, see the overview of seafood food loss.
Why fish is especially prone to loss
- It spoils fast: freshness drives quality, and temperature control matters hour by hour
- Supply is hard to predict: landings change greatly day to day with weather and stocks
- Many species and sizes: hard to standardize, and demand concentrates on "easy-to-sell" fish
- The recognition barrier: fish people do not know how to cook often fetch no price, however good the taste
Key points of this section
- Food loss is a decrease in quantity or quality, and in fisheries it includes discards at sea
- Markets and retail are where the walls of freshness and standards collide
By the numbers: where Japan and the world stand
Japan's total food loss
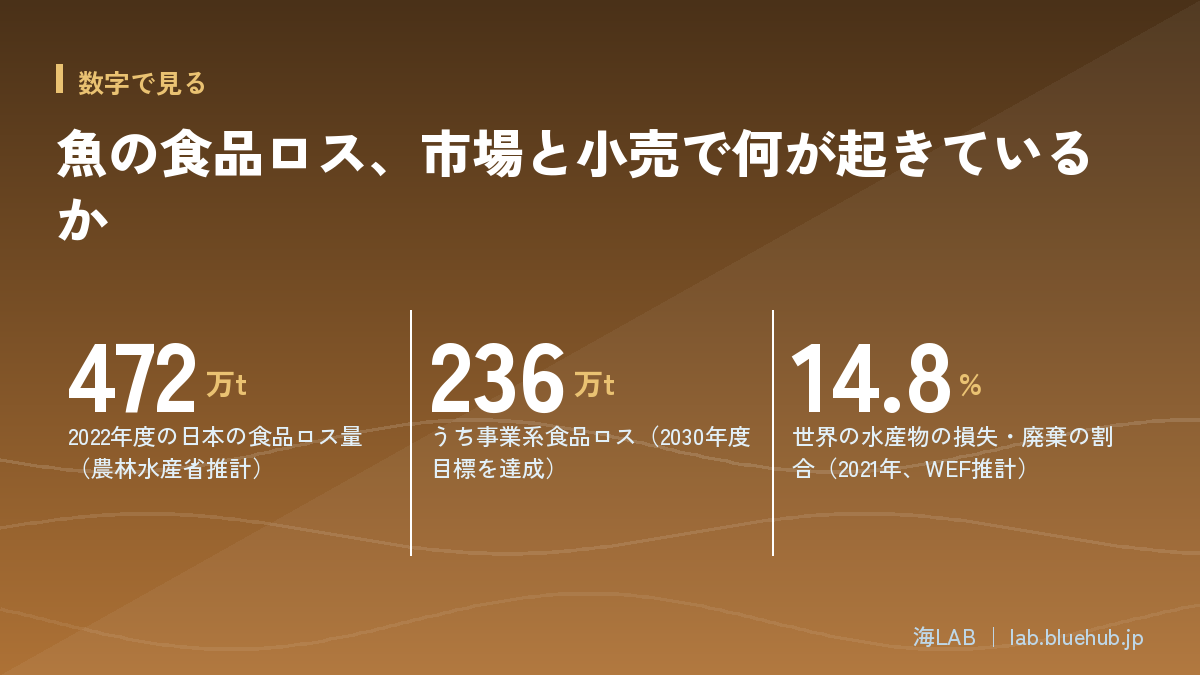
According to estimates MAFF published in June 2024, Japan's food loss in FY2022 was 4.72 million tonnes, down 0.51 million tonnes (9.8%) from 5.23 million tonnes the year before. The breakdown is 2.36 million tonnes from the business sector (food-related businesses) and 2.36 million tonnes from households.
| Category | FY2021 | FY2022 | Change |
|---|---|---|---|
| Total food loss | 5.23M t | 4.72M t | −0.51M t (−9.8%) |
| Business sector | 2.79M t | 2.36M t | −0.43M t (−15.4%) |
| Households | 2.44M t | 2.36M t | −0.08M t (−3.3%) |
For the business sector, the basic policy under the Food Recycling Act sets a target of halving loss by FY2030 compared with FY2000 (from 5.47 to 2.73 million tonnes). The FY2022 figure of 2.36 million tonnes is below that level, and MAFF says the target has been met.
The later estimate
An estimate published in 2026 reports that food loss in FY2024 was 4.61 million tonnes (4.64 million the year before), of which 2.37 million tonnes came from the business sector (2.31 million the year before). Household loss fell while business loss rose from the previous year. The figures show that loss does not necessarily keep falling after a target is met.
Note: these figures are not for seafood alone
- The amounts shown are estimates for all food, including meat, vegetables and grains
- A breakdown for seafood alone could not be extracted from the published materials we checked
Global seafood loss estimates
A 2024 study by the World Economic Forum (WEF) with the World Resources Institute (WRI) and others estimated that about 23.8 million tonnes of seafood were lost or wasted worldwide in 2021, equal to 14.8% of global production.
Another figure often quoted is that "about 35% of the catch is lost." It is said to derive from older FAO estimates, and the number is very different. Because the scope (whether discards at sea or processing are included) and the method of calculation differ, the two cannot be compared directly. Both are best read as indications that a considerable amount is being lost.
| Estimate | Figure | Characteristics |
|---|---|---|
| WEF/WRI (2024) | About 23.8M t in 2021, 14.8% of production | Recent estimate. Mind the scope |
| Figure attributed to the FAO | About 35% of the catch | Older estimate. Said to include discards at sea |
What happens at markets: the walls of freshness and standards
The role of wholesale markets
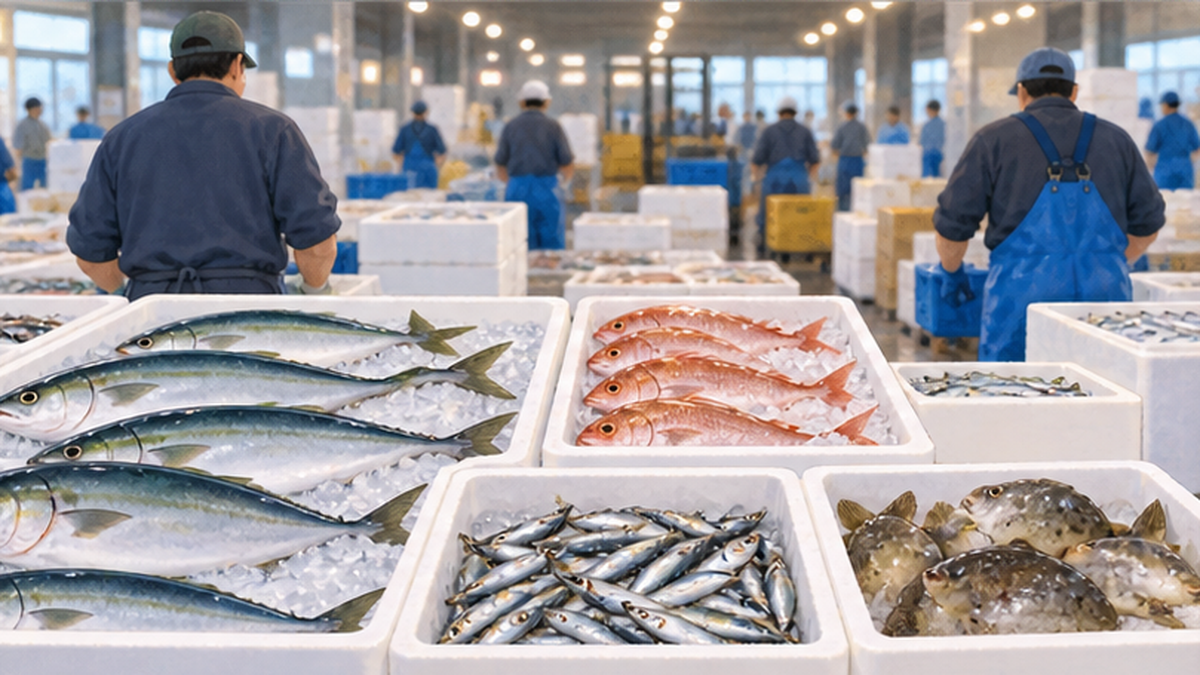
A wholesale market on the consumer side is a sorting hub that gathers fish from many regions and delivers it in the quantity and quality that supermarkets, fishmongers and restaurants need. A system that handles large volumes quickly is efficient, but it makes a certain amount of unsold and off-standard fish hard to avoid.
Where loss tends to arise at markets
- Mismatch between demand and arrivals: on days with heavy arrivals prices fall and some fish finds no buyer
- Size and appearance standards: small or scarred fish are shunned regardless of taste
- Skewed species: orders concentrate on well-known fish, leaving limited outlets for the rest
- Temperature control: if temperature rises during handling or waiting, quality drops even in a short time
However, we could not find an official statistic showing, by species, how much is discarded in market operations. The lack of numbers is itself one reason seafood loss is hard to grasp.
"No price" does not mean "no value"
In Japan, fish that rarely reaches the market because of catch volume, standards, recognition or the effort required is sometimes called "unused fish." There is no clear definition, but a report by the Japan Fisheries Association says about 1 million tonnes of fishery resources a year may be discarded in Japan. Note that this is an estimate, not an exact figure.
The Fisheries Agency has launched the "Miryo-gyo Project," which promotes the appeal of fish expected to gain wider use and added value, including low- and unused fish. For more, see our article on using unused fish.
Key points of this section
- Markets are sorting hubs, and standards for size and freshness make loss likely
- Unused fish may amount to about 1 million t a year, but this is not an exact figure
What happens at retail: the pressure never to run out
The difficulty of the fresh fish counter
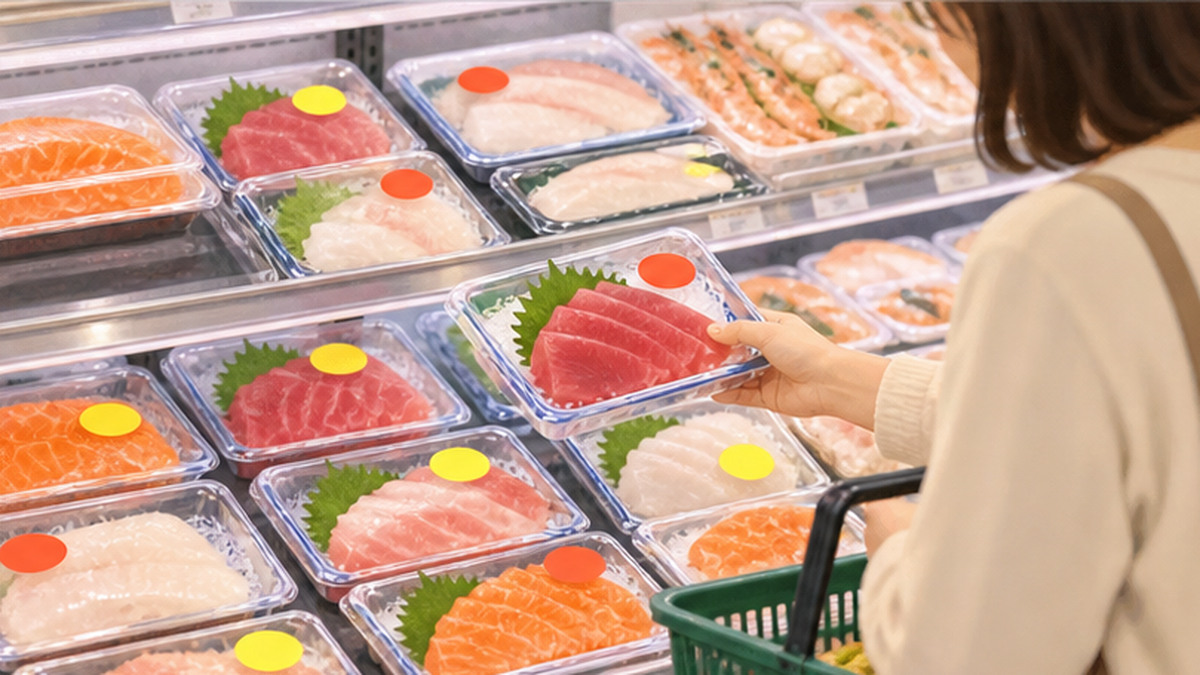
A supermarket fish counter is expected to have "fish always available" from opening to closing. A stock-out costs sales and also affects trust in the store. This leads to a tendency to over-order to avoid selling out, and what remains at closing becomes a candidate for markdown or disposal.
The background of retail food loss in general is covered in our article on supermarket food waste reduction. For fish, this is compounded by a short shelf life and the fact that fish spoils easily even after being cut and packed as fillets or sashimi.
Main causes of unsold fish
- Difficulty forecasting demand: weather, day of week, events and sales change sales greatly
- Appearance standards: color, the shape of the cut and the look of the pack affect purchases
- Setting the date: as the date nears, a decision to pull the item is needed
- Breadth of assortment: the more kinds on display, the greater the unsold risk per kind
Markdowns and clearance
The most familiar way to cut unsold stock is a markdown on items nearing their date. Many stores cut prices before closing to find buyers and sell out. Because fish spoils fast, a late markdown decision leaves it unsellable. The timing of the decision translates directly into the difference in waste.
Another approach is to turn fish that did not sell fresh into prepared dishes or processed goods (fries, simmered fish, sashimi bowls) the same day. It is an option mainly where the store has cooking facilities.
Key points of this section
- The wish to avoid stock-outs leads to over-ordering and unsold fish
- Markdown timing and turning fish into prepared dishes reduce waste
Reducing loss: technology, distribution and processing
Protect freshness: temperature control
The basis of cutting fish loss is keeping it cold from catch to store. If the chain breaks anywhere (cooling on the vessel, cold storage at the origin market, temperature maintenance in transport), quality falls even when appearance does not change. The FAO also says that cold storage and freezing facilities and better handling are important for reducing loss in fisheries.
Use it up: freezing and processing
Fish that is hard to sell fresh can be kept longer by freezing or processing. Surimi, dried fish, canned fish and seasoned frozen packs have longer dates and lower the risk of disposal. A study by Shizuoka Prefecture showed examples in which surimi products of grenadiers and dried alfonsino were commercialized and sold.
Connect: building sales channels
For using unused fish, matching fishers with processors and restaurants is important. Whether a distribution system from landing to sale can be built determines whether the fish actually moves. For little-known fish, there are examples of selling with serving suggestions and creative naming.
| Stage | Main measures | Expected effect |
|---|---|---|
| On board / origin | Cooling, better handling | Slower loss of freshness |
| Market | Cold storage, sorting to match demand | Fewer unsold fish |
| Retail | Demand forecasting, markdowns, prepared dishes | Less waste at the store |
| Processing | Freezing, surimi, dried fish | Longer shelf life, use of unused fish |
| Sales channels | Matching fishers and processors | Distribution of fish with no price |
Key points of this section
- Measures go in three directions: keep it cold, use it up, connect it
- No single one is enough; a combination at each stage is needed
What we can do: buying and eating
Choosing at the store
- Do not worry too much about small differences in appearance: uneven size or shape has nothing to do with taste or safety
- Choose marked-down items: if you will eat them that day, items near their date are a perfectly good option
- Try unused and under-used fish: chances to eat unfamiliar fish support the sales channel
- Buy only what you need: compare the pack size with what you will actually eat
Supporting shops and fishing areas
Choosing to use direct-from-origin mail order, shops that handle off-standard fish, and restaurants with menus using unused fish is another way to create demand. Your purchases can back mechanisms that reduce unsold stock.
Finishing fish at home
- Portion and freeze right away any fish you will not eat the day you buy it
- Think about using scraps and bones for stock or soup
- Note the date of the fish in your refrigerator where you can see it
Summary
- Fish food loss occurs at multiple stages from the vessel to the home
- Standards and freshness at markets, and the wish to avoid stock-outs at retail, tend to generate loss
- Numbers are mostly estimates, and the scope differs by source
- Keeping it cold, using it up, connecting it, and what buyers choose all reduce loss
Conclusion: look at the field, knowing the limits of the numbers
Japan's overall food loss has fallen, but official statistics showing the amounts for seafood alone, or for fish at markets and retail, are not well developed as far as we could confirm. Global estimates also range from 14.8% to about 35% depending on the source.
That is why it matters to check the source and scope when citing a number. Once you understand that fish is perishable and subject to walls of standards and recognition, what you can do through buying and eating becomes clear. Eating the gifts of the sea without waste also means valuing marine resources.
- Overall picture of seafood: overview of seafood food loss
- Using unused fish: using unused fish
- Retail efforts: supermarket food waste reduction
- Household efforts: household food loss
References and sources
- MAFF: Announcement of food loss estimates (FY2022) – 4.72M t food loss and 2.36M t business-sector loss in FY2022, and the reduction target
- Consumer Affairs Agency: Food loss reduction – Latest food loss estimates and reduction measures
- FAO Reducing food loss and waste in aquatic value chains – Definition of loss and waste in aquatic value chains
- World Economic Forum Investigating Global Aquatic Food Loss and Waste – White paper estimating global seafood loss at about 23.8M t
- Fisheries Agency – Measures for low- and unused fish, including the Miryo-gyo Project
- Japan Fisheries Association – Report on unused fish
* Listed in order of reliability: government agencies > academic institutions > peer-reviewed papers > specialist organizations > reliable media