⚡ In short
A breakdown of the IPCC's 2019 Special Report on the Ocean and Cryosphere (SROCC) across five axes: sea level rise, ocean acidification, deoxygenation, ice sheet melt, and marine heatwaves, including what it means for Japan's coasts.
"How much has the ocean been affected by global warming?" The Intergovernmental Panel on Climate Change (IPCC) gave a scientific answer to this question in September 2019 with its "Special Report on the Ocean and Cryosphere in a Changing Climate (SROCC)."
SROCC assessed the latest peer-reviewed literature from oceanographers, glaciologists, and cryosphere scientists worldwide, and showed that five interlinked changes — sea level rise, ocean acidification, deoxygenation, ice sheet melt, and marine heatwaves — are in fact progressing together. Changes in the ocean and cryosphere (glaciers, ice sheets, sea ice, snow cover, and permafrost) affect life everywhere on Earth, from high mountain regions to coastal cities and island nations.
This article organizes the key figures and future projections from SROCC, based on official materials from Japan's Ministry of the Environment and the original IPCC text, and explains what they mean for Japan's coasts and fisheries. We break down the technical terms so the report's core structure can be grasped in a single article.
What you'll learn in this article
- The background and significance of the IPCC Special Report on the Ocean and Cryosphere (SROCC)
- How the ocean has absorbed over 90% of global warming's heat, and at what cost
- The combined impact of ocean acidification and deoxygenation on marine ecosystems
- Glacier and ice sheet melt and future sea level rise projections by scenario
- Why marine heatwaves are becoming more frequent, and their ripple effects on ecosystems
- What SROCC means for Japan's coasts and fisheries
What Is SROCC? Background and Significance
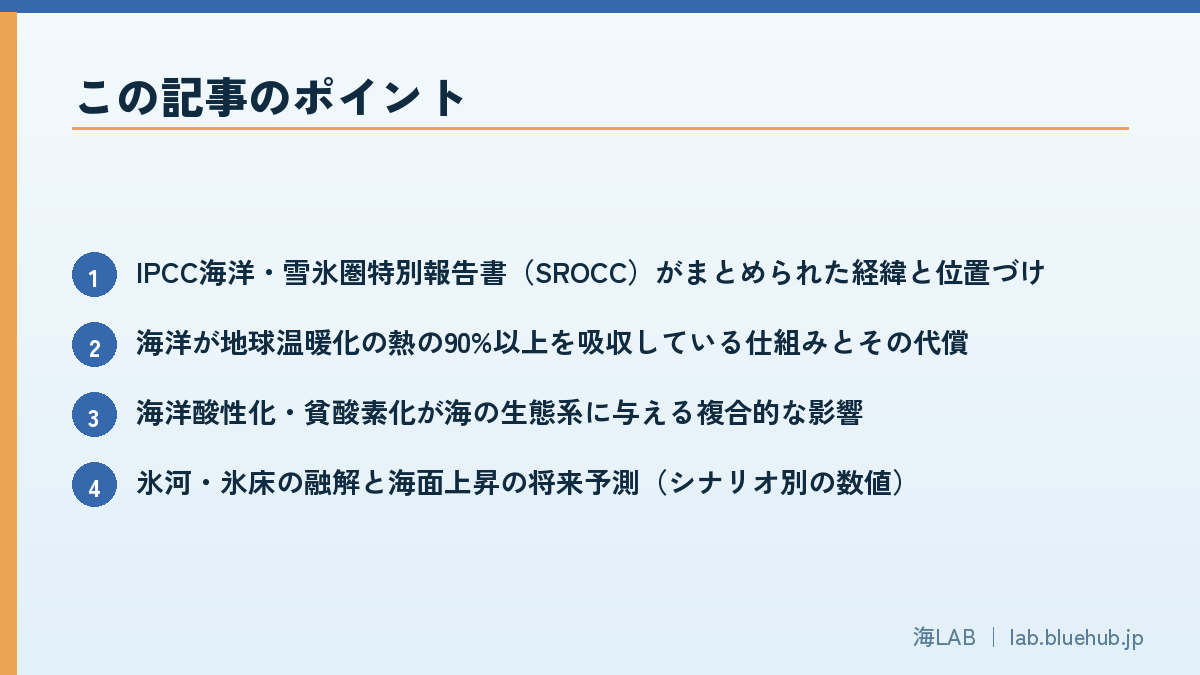
SROCC (Special Report on the Ocean and Cryosphere in a Changing Climate) is a special report whose production the IPCC decided on at its 43rd session in Nairobi, Kenya, in April 2016. Positioned as part of the Sixth Assessment Report (AR6) cycle, scientists worldwide assessed new peer-reviewed literature on the impacts of climate change in high mountain areas, polar regions, coastal zones, and the open ocean, and the report was approved and released at the 51st IPCC session held in Monaco on September 24, 2019.
The IPCC has published several special reports before, including the "1.5°C Special Report" and the "Special Report on Climate Change and Land," but SROCC is distinctive in integrating the ocean and cryosphere — themes that had often been discussed separately — into a single report. It was written with the participation of 104 experts from 36 countries and regions worldwide, following a large-scale review of roughly 7,000 scientific papers.
Why combine "ocean" and "cryosphere" into one report
At first glance, the ocean and the cryosphere (glaciers, ice sheets, sea ice, snow cover, permafrost) look like separate subjects. But SROCC integrated them into a single report because it placed weight on the close feedback loop connecting the two: melting ice sheets add water to the sea and raise sea level, while rising sea temperatures accelerate melting at the base of ice sheets.
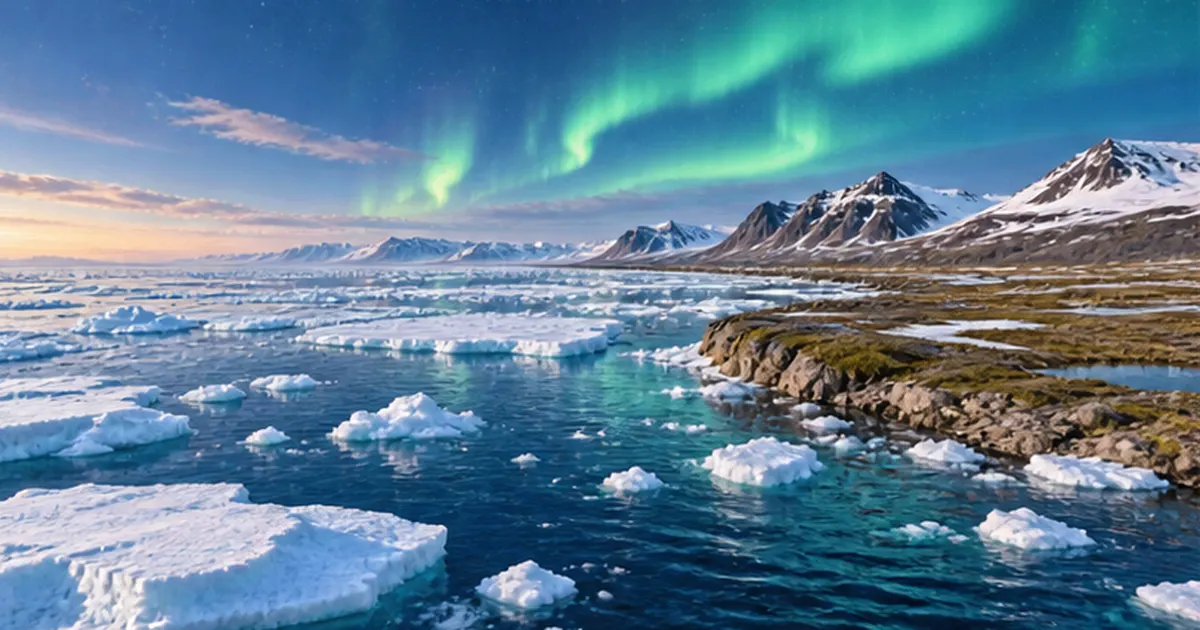
For example, when Arctic sea ice declines, the white ice that once reflected sunlight shrinks, exposing darker blue ocean surface instead. Because the ocean surface absorbs sunlight more readily than ice, sea temperatures rise further, accelerating the melting of the remaining sea ice. This kind of self-reinforcing vicious cycle (the ice-albedo feedback) is a textbook example of something that cannot be understood if the ocean and cryosphere are treated separately.
Similarly, meltwater flowing from mountain glaciers affects downstream river flow and water resource use before ultimately draining into the sea. Showing that changes occurring in seemingly different places — high mountains, polar regions, coasts, and the open ocean — are connected through a single water cycle is another hallmark of SROCC.
Regions assessed by SROCC
- High mountain areas (the Himalayas, Andes, Alps, etc.)
- Polar regions (the Arctic and Antarctic)
- Coastal zones and low-lying island nations
- The open ocean (from the surface to the deep sea)
SROCC's impact on international policy
The publication of SROCC did more than organize scientific knowledge — it also influenced subsequent international climate policy discussions. The risk assessments of sea level rise and ocean acidification presented in the report have repeatedly been cited as scientific grounds when countries revise their Nationally Determined Contributions (NDCs) under the Paris Agreement. The Alliance of Small Island States (AOSIS) and others have used SROCC's conclusions as grounds for calling for more ambitious emission reduction targets in international negotiations.
SROCC also received major coverage not only in academia but in the media, and is credited as one of the catalysts that increased how often terms like "sea level rise" and "ocean acidification" were discussed in mainstream outlets. It is regarded as a report that marked a turning point, carrying a sense of urgency shared among experts out to society at large.
The Ocean as Warming's "Buffer" — Absorbing Over 90% of Excess Heat
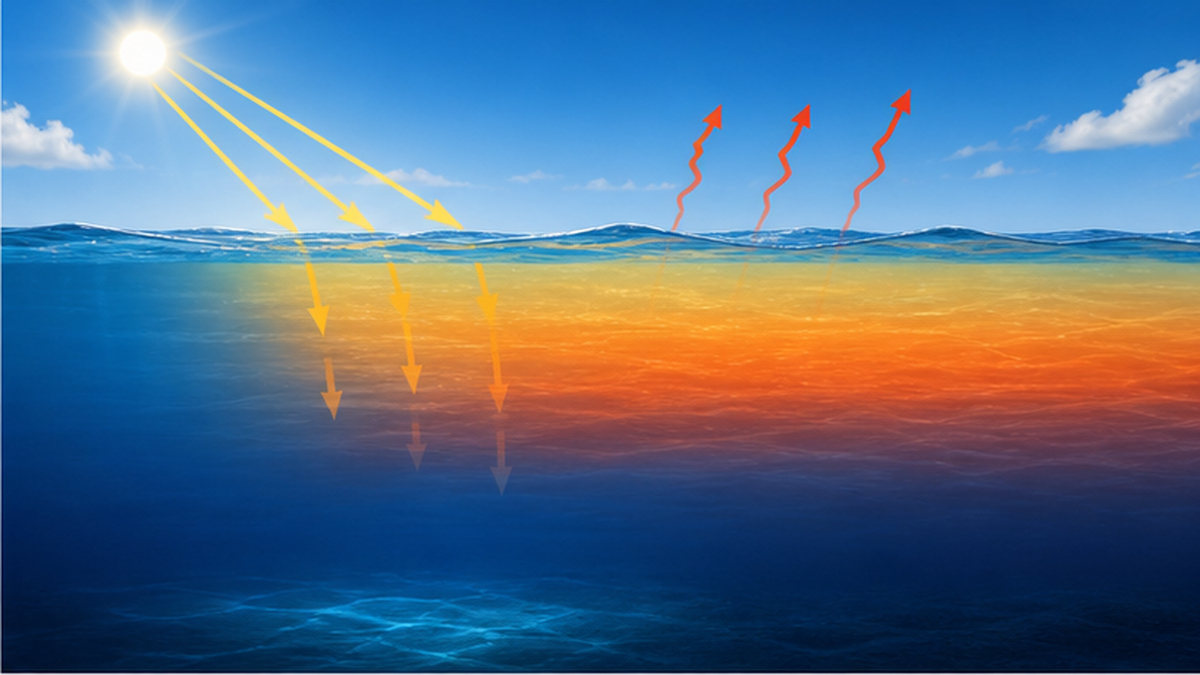
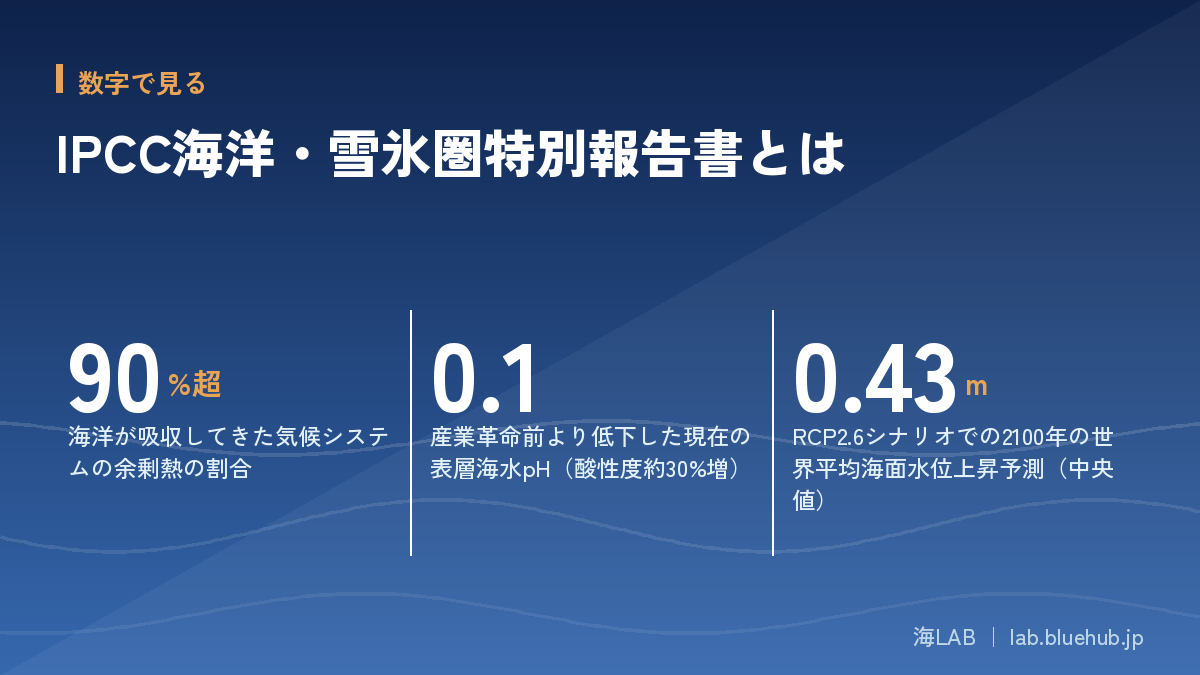
The most fundamental fact SROCC emphasizes is that the ocean has absorbed more than 90% of the excess heat energy the planet has received from greenhouse gases. The global ocean has warmed almost certainly since 1970, and the rate of ocean warming since 1993 has accelerated to more than double that of the preceding period.
This heat absorption is not limited to the surface. SROCC points out that warming has also been observed in the deep ocean down to 2,000m, showing that the ocean as a whole functions as a planet-scale "heat reservoir." Had the atmosphere alone been left to absorb this heat, the rise in land temperature would already have reached a far more severe level than it has today.
If the ocean hadn't absorbed this heat
Without the ocean's heat absorption, atmospheric warming would likely already have reached a far more severe level. But this "buffering" is not without cost. The absorbed heat expands seawater and contributes to sea level rise (thermal expansion), alters the speed and pathways of deep ocean circulation, and affects the distribution of fish and plankton sensitive to water temperature.
Impact on ocean circulation
SROCC notes that rising sea temperatures could also affect large-scale ocean circulation systems such as the Atlantic Meridional Overturning Circulation (AMOC). If the sinking of water into the deep ocean weakens, nutrient cycling and climate patterns themselves could shift, potentially rippling out to affect the distribution of fishery resources and patterns of heavy rain and drought.
How ocean heat is measured — the Argo float network
The ocean warming data presented in SROCC is underpinned by an international observation network called the "Argo program." About 3,000 floats (automated observation buoys) are deployed roughly every 300km across the world's oceans, measuring temperature and salinity from the surface down to 2,000m about every 10 days. The floats automatically dive and resurface, transmitting data via satellite that is distributed in real time, free of charge, to meteorological and oceanographic research institutions in every country. It is only because of this planet-scale observation network that a report like SROCC can quantitatively state that "the ocean has absorbed over 90% of the excess heat."
Ocean Acidification: Surface pH Down 0.1 From Pre-Industrial Levels
The ocean also absorbs some of the CO2 in the atmosphere, resulting in the acidification of surface seawater. According to SROCC, current surface ocean pH has fallen by about 0.1 compared to pre-industrial levels, which in terms of hydrogen ion concentration is equivalent to roughly a 30% increase in acidity. The rate of pH decline is estimated at about 0.0017 per year.
Because the pH scale is logarithmic, a seemingly small change of 0.1 actually carries significant chemical weight. As carbonate ion concentration in seawater decreases, the saturation state of calcium carbonate — used by shellfish and coral to build shells and skeletons — drops, making it harder for organisms to form and maintain them.
Impact on coral reefs and shellfish
Ocean acidification makes it harder for corals, shellfish, and plankton called pteropods to form the calcium carbonate shells and skeletons they need. SROCC notes that when ocean acidification combines with rising sea temperatures and deoxygenation, the impact extends to benthic and pelagic organisms and even to top predators at the summit of the food chain.
Ripple effects on aquaculture
In North America, acidified seawater has already been reported to harm oyster seed production, forcing the aquaculture industry to adopt water quality monitoring and mitigation measures. In Japan too, coastal areas with shellfish farms and seaweed beds are seen as facing similar risks in the future.
Regions where acidification progresses especially fast
Ocean acidification does not proceed uniformly across all sea regions. Because the naturally cold seawater of polar regions dissolves CO2 more readily and already has a lower calcium carbonate saturation state, SROCC notes that the effects of acidification tend to surface earlier in the Arctic and Southern Oceans than in lower-latitude waters. In coastal areas where deep water rises to the surface (upwelling), acidification's effects also tend to be more pronounced, since seawater with an already-shifted carbonate chemistry is carried upward.
The quiet impact on deep-sea organisms
The impact of ocean acidification is not confined to the surface. As atmospheric CO2 dissolves into seawater and is carried down to the deep ocean, SROCC notes that cold-water corals and thin-shelled plankton living in the deep sea are also affected by the decline in calcium carbonate saturation. Because the deep sea is difficult to observe and its changes are hard to detect, strengthening monitoring systems has become an international challenge.
| Indicator | Pre-industrial | Present (at time of SROCC assessment) |
|---|---|---|
| Surface ocean pH | About 8.2 | About 8.1 (down 0.1) |
| Change in acidity | Baseline | About +30% |
| Annual pH decline rate | — | About 0.0017/year |
Deoxygenation: Oxygen Loss Down to 1,000m
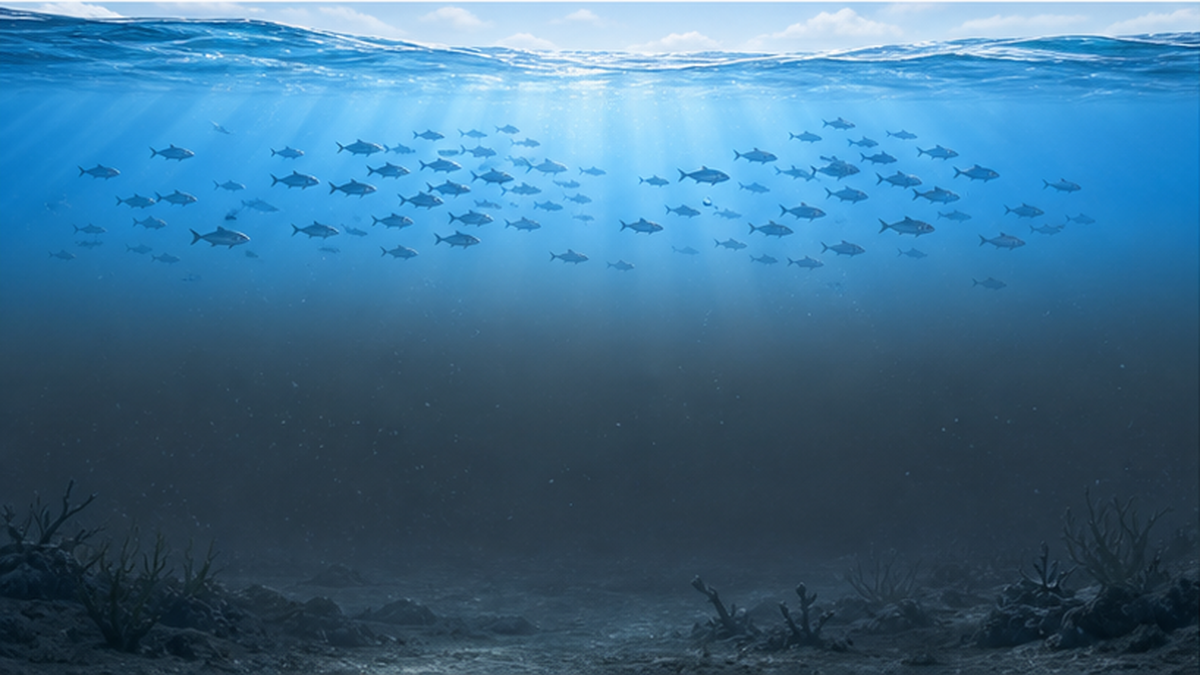
Rising sea temperatures reduce the amount of oxygen seawater can hold while also strengthening ocean stratification (layering), which impedes the supply of oxygen to deeper waters. SROCC assesses with medium confidence that oxygen loss has occurred from the surface down to a depth of 1,000m, and projects that oxygen decline will continue to progress alongside ocean warming.
Stratification refers to the phenomenon in which seawater separates into layers due to differences in temperature and salinity, making it harder for water above and below to mix. As surface seawater warms, the density difference grows larger, making it harder for oxygen-rich surface water to reach deeper layers. As a result, oxygen consumption continues in the deep ocean while supply decreases, and oxygen concentration gradually declines.
The risk of expanding "dead zones"
Sea areas with markedly low oxygen concentration are called "dead zones," where many marine organisms cannot survive. The number of dead zones reported along the world's coasts stood at about 400 as of 2008 and is now estimated at around 500, having roughly doubled every decade since the 1960s. In the Gulf of Mexico in the United States, a hypoxic water mass exceeding 20,000 square kilometers can form in summer, and one of the world's largest dead zones exists in the Baltic Sea in Europe.
As dead zones expand, fish and crustaceans such as shrimp and crab are forced to move to shallower, more oxygen-rich layers or to other sea areas, changing the fishing grounds themselves. SROCC treats deoxygenation as a compound risk, whose ecosystem impact becomes larger than that of a single factor when combined with ocean acidification and rising sea temperatures.
Expansion of oxygen minimum zones (OMZ)
The mid-depth layers of the open ocean contain naturally low-oxygen layers called "oxygen minimum zones" (OMZ). SROCC assesses that, as ocean warming and stratification progress, these oxygen minimum zones tend to expand in both volume and area. As OMZs expand, the depth range where migratory fish with high oxygen demand, such as tuna and marlin, can live narrows, compressing their habitat closer to the surface — a change that could bring new shifts to fisheries and ecosystem interactions.
The link with coastal eutrophication
Separately from deoxygenation in the open ocean, in coastal areas "eutrophication" — caused by the inflow of nutrients from domestic wastewater and agriculture — can worsen existing hypoxic water masses. SROCC points out that when the widespread deoxygenation caused by climate change overlaps with localized deoxygenation from human-caused pollution, the risk to coastal ecosystems is further heightened.
Glacier and Ice Sheet Melt and Future Sea Level Projections
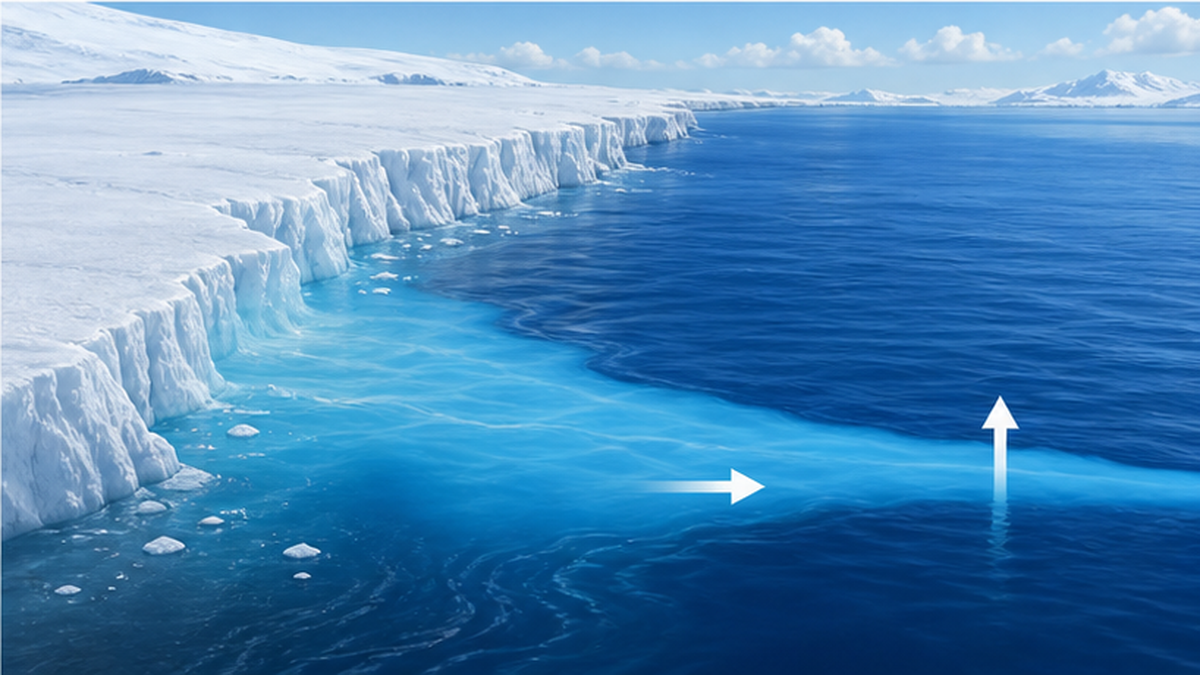
SROCC assesses that glaciers worldwide, excluding Greenland and Antarctica, lost mass at an average rate of 220±30 gigatons per year between 2006 and 2015, equivalent to raising global mean sea level by 0.61±0.08mm per year. The Greenland ice sheet has also continued to lose about 264 gigatons of ice per year on average since 2002.
Glacier and ice sheet melt is not simply a matter of "less ice" — the inflow of fresh water into the sea also changes the ocean's salinity and density structure, affecting ocean current patterns. SROCC discusses how, particularly in the Arctic and around Greenland, the inflow of meltwater could weaken local ocean circulation.
Sea level rise scenarios through 2100
SROCC presented projections of global mean sea level (GMSL) rise by greenhouse gas emission scenario (RCP). Under the low-emission RCP2.6 scenario, relative to the 1986-2005 baseline, a rise of 0.43m (likely range 0.29-0.59m) is expected by 2100, while the high-emission RCP8.5 scenario projects an even larger rise — a figure that was revised upward from the Fifth Assessment Report (AR5).
The main reason for this upward revision is updated scientific understanding of the instability of the Antarctic ice sheet. With the newly incorporated mechanism of "marine ice sheet instability," in which the parts of an ice sheet in contact with the sea can collapse rapidly, the risk of sea level rise after 2100 under high-emission scenarios came to be assessed as more severe.
The West Antarctic Ice Sheet and the spotlight on Thwaites Glacier
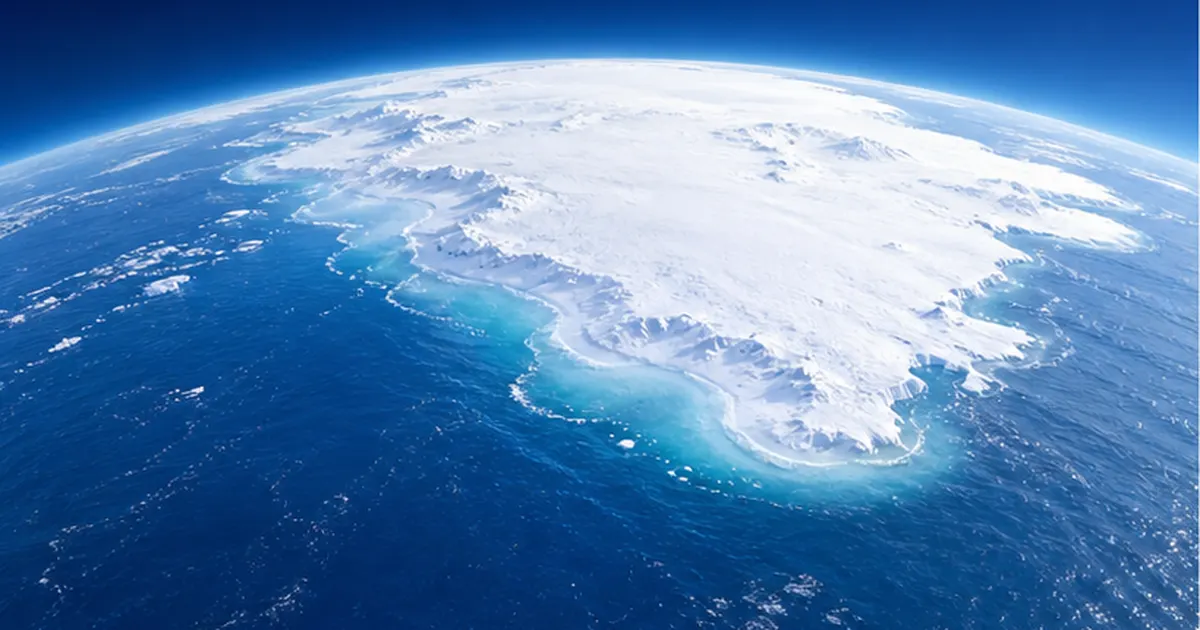
The Antarctic ice sheet as a whole is losing mass at an average rate of 155±19 gigatons per year, most of it due to the rapid thinning and retreat of major glaciers draining the West Antarctic Ice Sheet. Thwaites Glacier in particular is considered at especially high risk of collapse because of the terrain beneath the ice sheet, which allows warm seawater to intrude easily, and it has drawn international attention as a symbolic case of "marine ice sheet instability," where collapse could destabilize surrounding ice in a chain reaction. Given the high uncertainty of this process, SROCC notes the possibility that melting could accelerate further after 2100 under high-emission scenarios.
| Scenario | 2100 sea level rise (median) | Likely range |
|---|---|---|
| RCP2.6 (low emission) | 0.43m | 0.29-0.59m |
| RCP8.5 (high emission) | Revised upward from AR5 | A larger rise |
The rise continues beyond 2100
Another key point SROCC emphasizes is that, because the ocean and ice sheets respond with a lag of decades to centuries, sea level rise will not stop at 2100 but will continue over the long term even if warming is curbed by the end of this century. There is a long time lag before the effects of emission reductions show up in sea level.
Extreme sea level events becoming "annual"
Another important projection SROCC presented concerns not the "average" sea level but the frequency of "extreme sea level events." The report assesses that for every further 1°C rise in global average temperature, extreme sea level events that used to occur only once a century will, by mid-century, occur every year in many coastal regions.
This means that, due to the underlying rise in sea level, storm surge flooding that had been treated as a "rare disaster" will become an "annual occurrence." SROCC warns that low-lying coastal cities and low-elevation island nations urgently need fundamental adaptation measures, such as raising seawalls and rethinking land use.
Sea level rise depends on "the choices we make now"
In a 2019 press release, the IPCC stressed that "the choices we make now determine the future of the ocean and cryosphere." Scenarios that curb greenhouse gas emissions versus those that do not produce a difference of several tens of centimeters in 2100 sea level.
Change in the Arctic: Sea Ice Decline and Permafrost Thaw
Changes in the cryosphere are not limited to the glaciers and ice sheets directly tied to sea level rise. Arctic sea ice itself, floating on the ocean, is also a key indicator SROCC emphasizes. It is very likely that average annual Arctic sea ice extent declined at a rate of roughly 3.5-9% per decade between 1979 and 2012, and recent observations show the pace of decline has quickened further.
The Arctic Ocean's shift to "younger ice"
What SROCC pays particular attention to is the change not just in area but in the "quality" of the ice. Thick, stable multi-year ice that has persisted for five years or more is reported to have declined by about 90% in its share of ice area between 1979 and 2018. Arctic sea ice is rapidly being replaced by thin "younger ice" that melts more easily each season, a factor that raises the risk of abrupt future sea ice loss.
Under the high-emission RCP8.5 scenario, it is said the Arctic Ocean could reach a "practically ice-free" state in summer (September) by around 2050. The loss of Arctic sea ice would lower the reflectivity of sunlight (albedo), further accelerating warming, and would also have geopolitical implications, affecting Arctic ecosystems and Indigenous livelihoods and opening the way to new shipping routes.
Permafrost thaw and the awakening of carbon
Changes in "permafrost" — ground that remains frozen year-round across the Arctic — are another theme SROCC emphasizes. The temperature of continuous Arctic permafrost is assessed to have risen by 0.39±0.15°C between 2007 and 2016.
The vast carbon stored in permafrost
Permafrost in the Northern Hemisphere is estimated to hold organic carbon roughly twice the amount currently present in the atmosphere. When permafrost thaws, the organic matter trapped within it is broken down by microbes and released into the atmosphere as carbon dioxide and methane. SROCC assesses that 5-15% of this carbon could be released during this century.
The "vicious cycle" that accelerates warming
Because methane has a far greater greenhouse effect than the same amount of carbon dioxide (roughly 28 times as much), methane release from permafrost could accelerate warming and trigger further permafrost thaw — a self-reinforcing vicious cycle (positive feedback). Much of this process remains poorly understood, and SROCC treats it as one factor that increases uncertainty in future projections.
Impact on infrastructure built on frozen ground
Permafrost thaw is not just a greenhouse gas issue — it also directly affects the stability of roads, buildings, and pipelines built on top of it. As the ground subsides and deforms with thawing, cold regions such as Siberia and Alaska have reported tilting and damage to structures and disruptions to transport routes, a risk SROCC treats as shaking the very foundations of local communities' lives.
- Arctic permafrost temperature rose by 0.39±0.15°C between 2007 and 2016
- Permafrost stores about twice the amount of carbon in the atmosphere
- 5-15% of that carbon could be released during this century
- Risk of a vicious cycle in which methane release accelerates warming
The Rise of Marine Heatwaves and Their Impact
A "marine heatwave" refers to a phenomenon in which water temperature in a given sea area remains markedly above normal for days to months. SROCC assesses with very high confidence that the frequency of marine heatwaves has nearly doubled since 1982, with intensity also increasing.
Analysis using satellite sea surface temperature observation data confirms a large increase in the annual number of marine heatwave days between 1982 and 2016. A study comparing 1925-1954 with 1987-2016 also reported that the annual number of marine heatwave days increased by more than 50% worldwide.
The chain reaction to coral bleaching and ecosystems
Marine heatwaves can trigger coral bleaching, the loss of seaweed beds, and mass die-offs of fish. On Australia's Great Barrier Reef, large-scale bleaching events tied to marine heatwaves have occurred repeatedly, raising concern that bleaching is happening too frequently for recovery to keep pace. For a detailed explanation of the mechanism and ecosystem impact, see What Is a Marine Heatwave?.
Direct blows to fisheries and aquaculture
Marine heatwaves directly affect fishing economies, not just ecosystems. In a large-scale marine heatwave off the west coast of North America known as "the Blob," shifts in fish species distribution and mass outbreaks of harmful algae occurred, and some fisheries were forced to suspend operations.
Marine heatwaves observed around Japan too
Marine heatwaves are not someone else's problem for the waters around Japan either. According to observations by the Japan Meteorological Agency, a marine heatwave in the summer of 2023 (June-August) brought the highest sea surface temperatures around northern Japan since 1985, with notably high temperatures recorded off Sanriku down to a depth of 300m. The 2023 annual average sea surface temperature anomaly around Japan was the highest since record-keeping began in 1908, with anomalies exceeding +4°C southeast of Hokkaido and east of Honshu, and over +3°C in the Sea of Japan, in September. Such high temperatures are drawing attention as a risk factor for farmed fish die-offs and poor seaweed growth.
- Satellite observation data from 1982-2016 shows sea surface temperature marine heatwave frequency has doubled
- Intensity and duration are also on the rise
- Compound impacts on coral reefs, seaweed beds, and fishery resources
- Increased risk of harmful algal blooms
What This Means for Japan's Coasts and Fisheries
Sea surface temperatures around Japan have risen by roughly +1.14°C per 100 years over the past century, a pace faster than the global average rate of +0.55°C per 100 years. As a result, the distribution of species such as yellowtail and Spanish mackerel has shifted northward, with yellowtail catches surging in Hokkaido — concrete changes now visible on the ground in the fishing industry.
Materials from Japan's Fisheries Agency also continue to report on the relationship between changing ocean conditions and fishery resources, with more fishers being forced to change fishing grounds and seasons. The trends of ocean warming, acidification, and deoxygenation shown by SROCC are consistent with these changes seen on the ground in Japan.
Coral distribution is shifting north too
Rising sea temperatures are shifting the distribution not just of fish but of coral. The northern limit of coral distribution in Japan has traditionally been Chiba Prefecture on the Pacific side and the Tsushima/Iki area on the Sea of Japan side, but in recent years table coral has been confirmed living in Yokosuka, Kanagawa Prefecture, with a survey reporting it extended the previous northern-limit record by about 30km. This is thought to be driven both by larvae being carried more easily on the Kuroshio and Tsushima currents, and by sea temperatures at these northward locations entering the range in which coral can survive.
Sea level rise and coastal infrastructure
The sea level rise scenarios presented by SROCC are directly tied to the loss of Japan's sandy beaches, saltwater intrusion into ports and groundwater, and increased storm surge risk. Materials from Japan's Ministry of Land, Infrastructure, Transport and Tourism and the Japan Meteorological Agency also project, on average for Japan's coasts, a rise of 0.39m under the 2°C-rise scenario (RCP2.6) and 0.71m under the 4°C-rise scenario (RCP8.5) by the end of the 21st century; specific figures and hazards are covered in detail in Could Sea Level Rise Wipe Out 90% of Japan's Beaches?.
The compound risk of typhoons and storm surge
When a typhoon-driven storm surge occurs on top of an already elevated sea level, flooding extent and damage can expand more easily even for a typhoon of the same strength. For the mechanism by which rising sea temperatures themselves relate to the rapid intensification of typhoons, see Why Do Typhoons Intensify as Sea Temperatures Rise?.
For changes in fish distribution, also see Fish Distribution Shifting North: How Warming Is Changing the Home Ground and Dinner Table of Yellowtail, Spanish Mackerel, and Saury, and for the impact of ocean acidification on coral reefs, see The Mechanism of Ocean Acidification and Its Impact on Ecosystems.
Beyond SROCC: Carried Forward Into AR6, and What We Can Do
The findings presented in SROCC were carried forward into the IPCC's Sixth Assessment Report (AR6) Working Group I report, published in 2021, which further updated sea level rise projections using SSP scenarios. AR6 projects a rise of 0.32-0.62m by 2081-2100 under SSP1-2.6, and 0.63-1.01m under SSP5-8.5.
AR6 also deepened discussion of "low-probability but high-impact" scenarios such as rapid Antarctic ice sheet collapse, presenting a more cautious assessment that the possibility of sea level rise exceeding 2m by 2100 cannot be entirely ruled out. The IPCC has continued its assessment cycles since then, and the framework SROCC established — assessing the ocean and cryosphere as an integrated whole — continues to serve as a foundation for subsequent synthesis reports and countries' adaptation planning.
The link to the Paris Agreement's targets
The figures presented by SROCC and AR6 also underpin the importance of the Paris Agreement's goal of "holding the increase in global average temperature to well below 2°C above pre-industrial levels and pursuing efforts to limit it to 1.5°C." SROCC assesses that whether warming is held to 1.5°C or allowed to reach 2°C or beyond makes a major difference to the eventual endpoint of sea level rise and to the threshold at which glacier and ice sheet melt becomes "irreversible."
Challenges for future observation and research
SROCC also points out that there remain areas current observation networks have yet to fully capture. Items such as warming in the deep sea (below 2,000m), sea ice variability around Antarctica, and the amount of carbon released from permafrost carry large uncertainty, and more precise future projections will require deploying next-generation Argo floats equipped with biogeochemical sensors (BGC-Argo) and strengthening integrated monitoring systems that combine satellite and in-situ observation.
What the report's message of "the choices we make now" means
The choices we make now determine the future of the ocean and cryosphere.
— IPCC press release, September 25, 2019
If SROCC's conclusion can be summed up in one line, it is this: much of the change underway in the ocean and cryosphere carries an "inertia" that will continue for decades to centuries to come, but the pace of that progression and its eventual endpoint can still change greatly depending on future greenhouse gas emissions. Choosing a low-emission scenario can moderate the progress of sea level rise and ocean acidification, buying ecosystems and coastal communities more time to adapt.
Adaptation and mitigation actions for individuals and communities
- Contribute to CO2 emission reductions by choosing energy efficiency and renewable energy
- Check your local storm surge and flood hazard maps and prepare evacuation plans
- Choose sustainable seafood (such as MSC-certified products) to reduce pressure on fishery resources
- Take an interest in conserving coastal natural ecosystems (seaweed beds, tidal flats, coral reefs)
Key points of this article
- The ocean has absorbed over 90% of warming's excess heat and continues to warm
- Surface ocean pH has dropped 0.1 from pre-industrial levels (about a 30% rise in acidity)
- Deoxygenation is progressing down to a depth of 1,000m
- Glacier and ice sheet melt is accelerating; sea level is projected to rise 0.43m by 2100 even under RCP2.6
- Marine heatwave frequency has nearly doubled since 1982
- Warming around Japan is faster than the global average, already affecting fisheries and coastal infrastructure
References and Sources
- Japan Ministry of the Environment, "Overview of the IPCC Special Report on the Ocean and Cryosphere" – Japanese-language overview based on the SPM and full report
- Japan Ministry of the Environment, "IPCC Special Report on the Ocean and Cryosphere in a Changing Climate: Summary for Policymakers" – Japanese translation of the SPM
- IPCC, "Special Report on the Ocean and Cryosphere in a Changing Climate" – Original SROCC text (English)
- Japan Ministry of the Environment press release, "Publication of the IPCC Special Report on the Ocean and Cryosphere" – Results of the 51st IPCC session
- United Nations Information Centre, "The Choices We Make Now Determine the Future of the Ocean and Cryosphere" – Japanese translation of the IPCC press release dated September 25, 2019
- Ocean Policy Research Institute, Sasakawa Peace Foundation, "Exploring the Message of the IPCC Special Report on the Ocean and Cryosphere" – Ocean Newsletter
- Japan Meteorological Agency, "Climate Change in Japan 2025" – Report on observations and projections for the atmosphere, land, and ocean
- Japan Fisheries Agency, "Trends in Fishing Ground Environments" – Fisheries White Paper
* Listed in order of reliability: government/academic institutions > peer-reviewed papers > specialized organizations > reputable media