⚡ In short
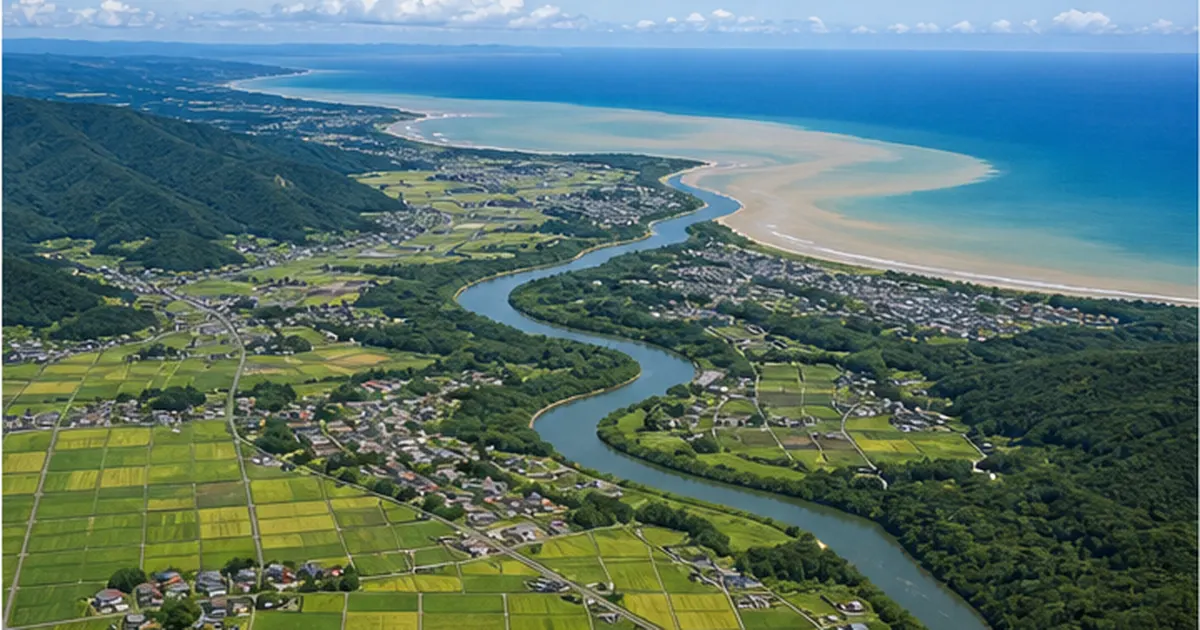
Fertilizer spread on fields, water draining from kitchens, waste from cattle sheds — the nitrogen and phosphorus applied on land follow rivers to the sea and drive eutrophication. This article traces where the loading comes from, what Japan achieved in fifty years of reduction, and the new problem of a sea made too clean.
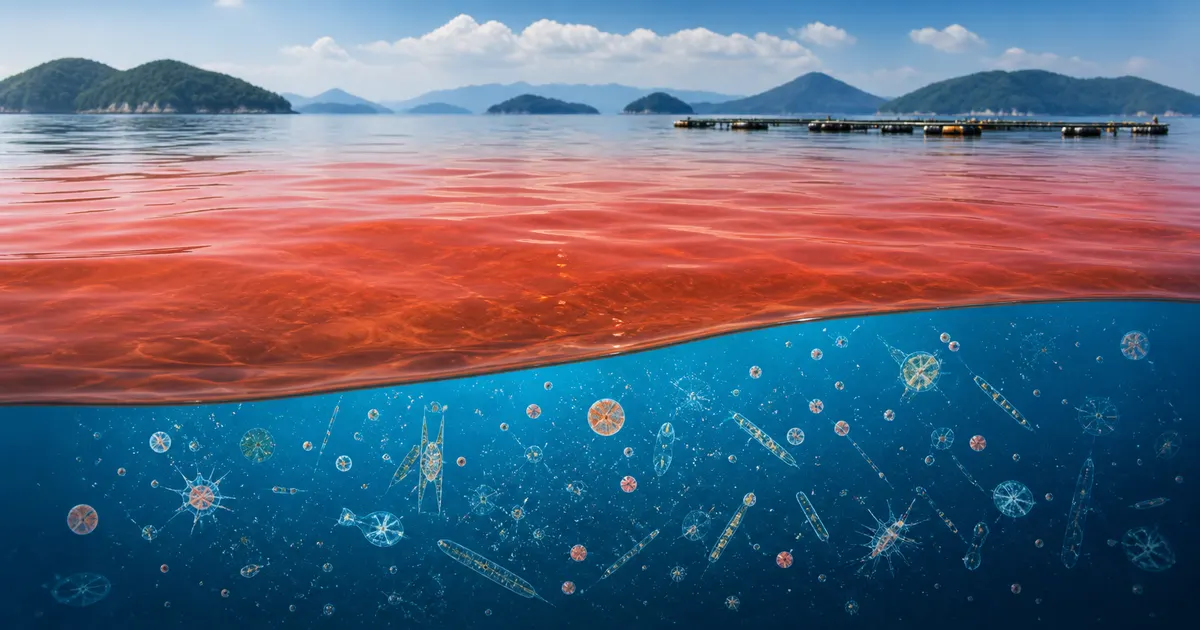
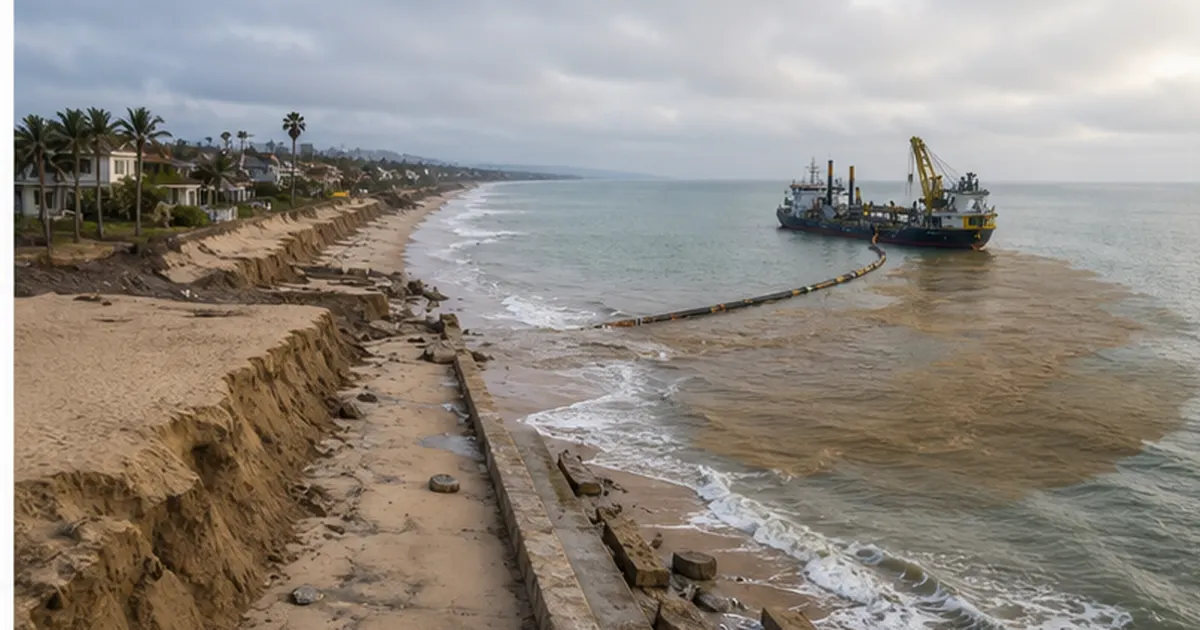
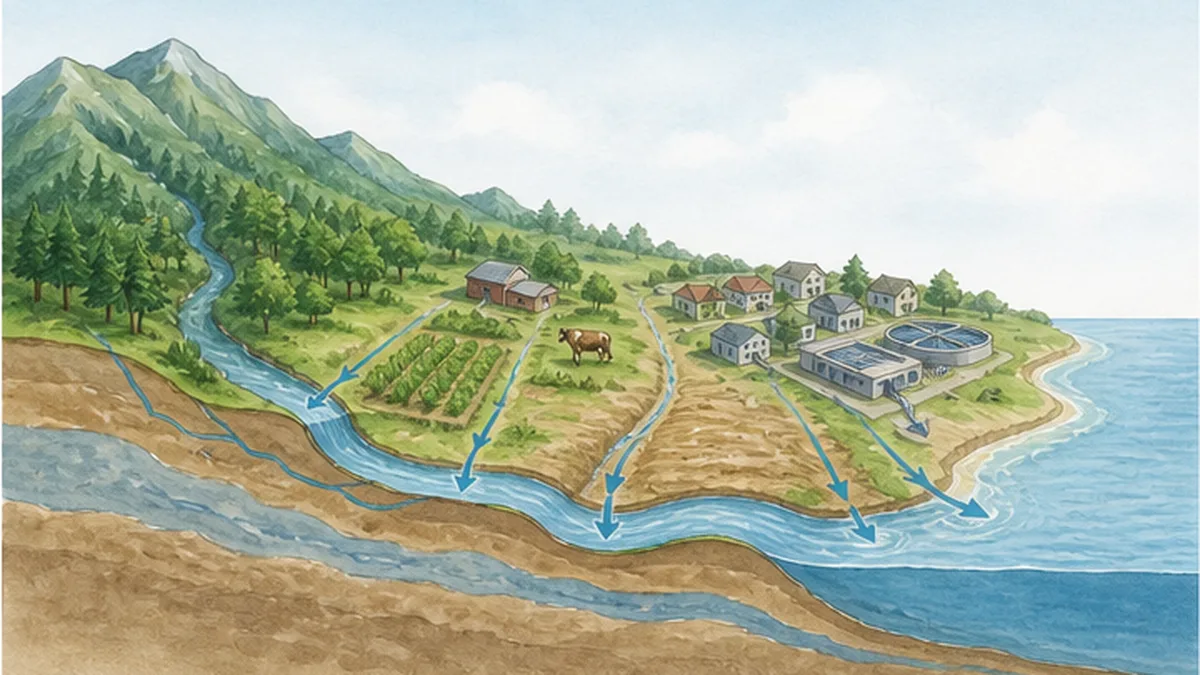
There are days when the sea changes color. The water inside the harbor turns a muddy reddish brown, fish float in aquaculture pens, and shells wash up on the beach. The trigger, more often than not, is nitrogen and phosphorus applied far inland. Fertilizer from fields, waste from cattle sheds, water draining from kitchen sinks — all are byproducts of the activities that sustain our lives, and none of them is a poison in itself. To phytoplankton, in fact, they are a long-awaited feast.
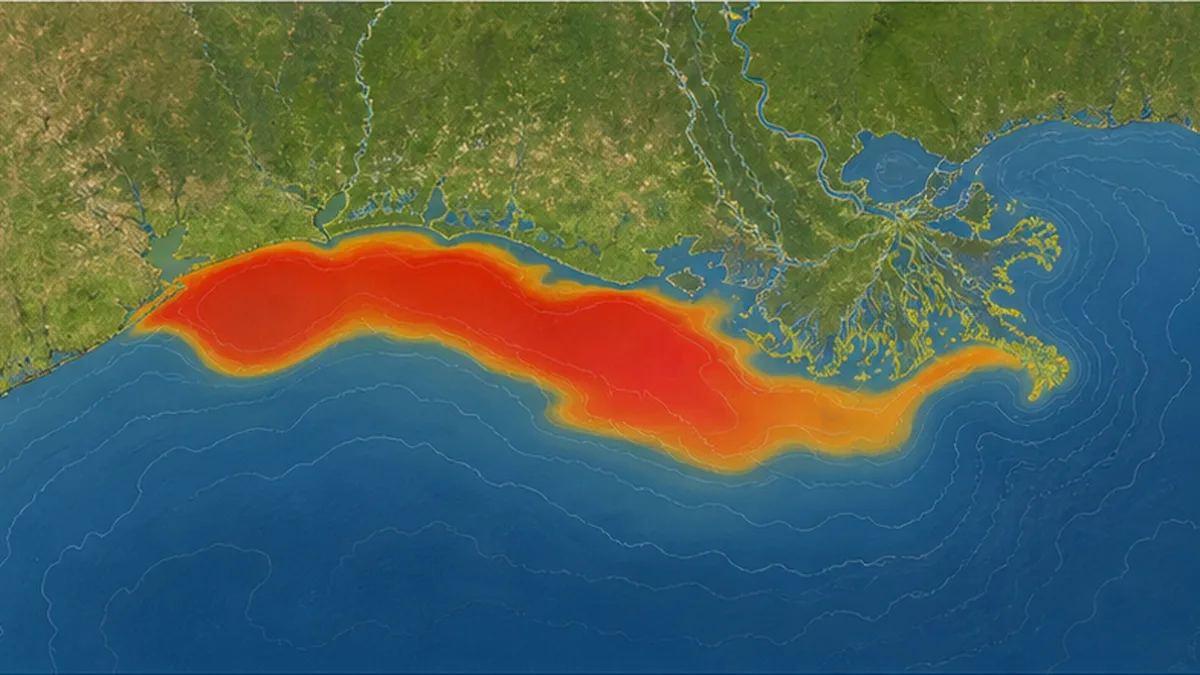
The problem is quantity and timing. When more nutrients arrive than the sea can absorb, delivered in concentrated pulses with every rainfall, that bounty turns into the disaster we call eutrophication. Plankton multiply explosively, die, sink, and in the process of decomposition consume the oxygen at the seafloor. Nothing lives there — not fish, not shrimp, not crab. The hypoxic zone that US researchers measured in the Gulf of Mexico in July 2025 covered 4,402 square miles (about 11,400 km²) — an area of seafloor roughly equal to Japan's Akita Prefecture, uninhabitable for the length of the summer.
This article shifts the vantage point from "inside the sea" to "from land to sea." Where do nitrogen and phosphorus originate, and by what routes do they reach the ocean? What has Japan's half-century of load reduction achieved, and what unexpected problem — a sea made "too clean" — has it produced? And where in a watershed is intervention most effective? We work through these questions using primary sources from Japan's Ministry of the Environment, Ministry of Land, Infrastructure, Transport and Tourism, Ministry of Agriculture, Forestry and Fisheries, and the US NOAA.
What you will learn in this article
- Where the line falls between nitrogen and phosphorus as "nutrients" and as "pollution"
- The sources of nitrogen and phosphorus reaching the sea — household wastewater, industrial effluent, farmland, livestock, the atmosphere — and how hard each is to reduce
- The time-lagged chain of events from a nutrient surge to oxygen depletion at the seafloor
- What the Gulf of Mexico and the Baltic Sea, the world's largest eutrophication programs, have and have not achieved
- What Japan's total pollutant load control system has delivered since 1979, and the "sea that is too clean" problem now emerging
- What can be done to reduce loads through sewerage, septic systems, farmland, and the dinner table
What eutrophication is — what happens when there is too much nutrition
Eutrophication refers to a phenomenon in which nutrient salts such as nitrogen and phosphorus are supplied to a body of water in excess, phytoplankton and algae proliferate abnormally, and the ecological balance of that water body collapses. The word originally described the natural aging process by which a lake accumulates silt and organic matter over long ages and shifts from oligotrophic to eutrophic. In the latter half of the twentieth century, human activity compressed that process into a matter of decades.
Why nitrogen and phosphorus are essential nutrients
Nitrogen is indispensable for building proteins and nucleic acids; phosphorus for DNA and RNA, cell membranes, and ATP, the cell's energy currency. Phytoplankton at the base of the marine food web are no exception — light and carbon dioxide alone are not enough for them to grow. In the 1930s the oceanographer Alfred Redfield found that phytoplankton in the open ocean take up carbon, nitrogen, and phosphorus in an atomic ratio of roughly 106:16:1. This Redfield ratio is still used as a yardstick for judging which nutrient sets the ceiling on growth — the limiting factor.
Across much of the open ocean, a shortage of nitrogen keeps plankton biomass in check. In estuaries and inner bays, where water from the land converges, the situation reverses and both nitrogen and phosphorus tend to arrive in oversupply. Phosphorus tends to be limiting in freshwater lakes, nitrogen in the sea — a difference that explains why countermeasures for lakes and for oceans place their emphasis in different places.
Point sources and nonpoint sources — pollution that is easy to cut, and pollution that is not
Sources of loading fall broadly into two categories: "point sources," where the origin can be pinpointed, such as the outfall of a factory or sewage treatment plant, and "nonpoint sources," which seep out thinly and widely from farmland, urban areas, and forests with every rainfall.
This distinction is not merely academic. Point sources can be reliably reduced by setting effluent standards, building treatment facilities, and monitoring them. Indeed, most of the water quality improvement achieved by industrialized countries including Japan in the twentieth century came from point-source control. Nonpoint sources, by contrast, have neither an identifiable outfall nor an identifiable owner, and their discharge can vary by an order of magnitude depending on how the rain falls. They resist regulation, and their cost-effectiveness is hard to predict. The reason so many countries stall just short of their eutrophication targets is that what remains is nonpoint.
| Category | Main sources | Characteristics | Difficulty of control |
|---|---|---|---|
| Point source | Sewage treatment plants, factory and business effluent, aquaculture feed | Outfall can be identified and volumes are relatively stable. Monitoring and regulation are possible | Falls reliably given technology and funding |
| Nonpoint source | Farmland, livestock, urban road surfaces, forests, stormwater overflows | Discharged in concentrated pulses during rainfall. Highly variable and with diffuse responsibility | Ill-suited to regulation; requires watershed-wide consensus |
| Atmospheric route | Nitrogen oxides from vehicles and factories, volatilized ammonia | Enters water bodies through deposition. Can cross national borders | Must advance together with air pollution control |
Three perspectives to keep in mind
- Eutrophication is not an "accident at sea" but a slow change playing out across the wider stage of a watershed
- Nitrogen and phosphorus are not villains. Places with too much and places with too little exist at the same time
- Many countries have largely exhausted point-source measures; the coming battleground is nonpoint sources and watershed management
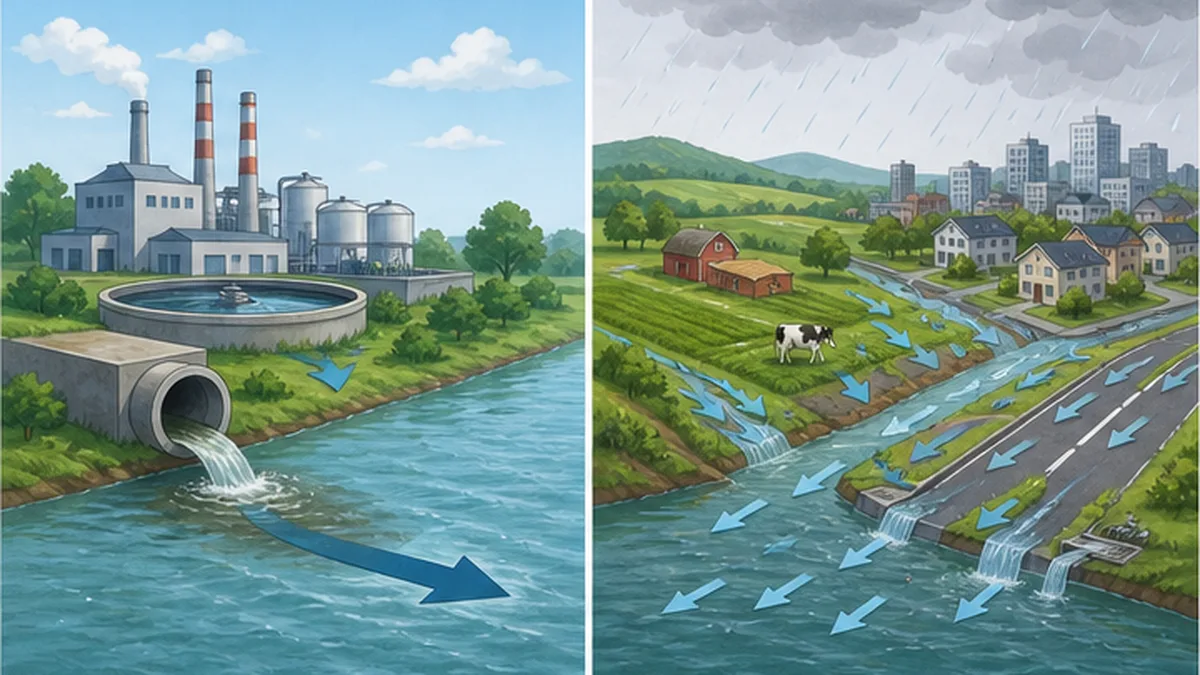
Where nitrogen and phosphorus come from — four routes from land to sea
Trace the nutrients that reach the sea and their headwaters turn out to be surprisingly close to home. Here we follow the four main routes, with Japanese statistics alongside.
1. Household wastewater — the closest to home and the largest
When discussing loading in inner bays, the sheer weight of household wastewater often comes as a surprise. According to the Ministry of the Environment's pollutant load estimation survey, household sources account for roughly two-thirds of the COD (chemical oxygen demand) load flowing into Tokyo Bay, with industrial sources at around 20% and other sources a little over 10%. In densely populated metropolitan bays, our kitchens, baths, and toilets outweigh the factories in sheer quantity.
Most of that flow does pass through treatment plants, of course. In figures released jointly in August 2025 by the Ministry of Land, Infrastructure, Transport and Tourism, the Ministry of Agriculture, Forestry and Fisheries, and the Ministry of the Environment, the wastewater treatment coverage rate at the end of FY2024 stood at 93.7%, up 0.4 points from the previous year. Of that, sewerage systems served 101.4 million people (81.8%), septic tanks 11.75 million (9.5%), and rural community wastewater facilities 2.83 million (2.3%). Which means the inverse is also true: household wastewater from about 6% of the population — close to eight million people — still reaches rivers, and then the sea, without adequate treatment.
Nor does treatment alone settle the matter. Standard sewage treatment (the conventional activated sludge process) excels at removing organic matter but takes out far less nitrogen and phosphorus than one might assume. Removing those requires advanced treatment that combines anaerobic and aerobic stages. For the same reason, single-purpose septic tanks that treat only toilet waste while letting kitchen, bath, and laundry water pass straight through are now banned for new installation, and conversion to combined treatment tanks is being promoted nationwide.
2. Farmland — some fertilizer always leaves with something other than the crop
Not all of the nitrogen fertilizer applied to a field ends up in the harvest. Converted to nitrate ions in the soil, nitrogen dissolves readily in water and adsorbs poorly to soil particles, so it escapes with rain and irrigation water into groundwater and drainage channels. Phosphorus, which adsorbs strongly to soil particles, is lost less by dissolution than by the runoff of the soil itself as turbid water. That is why controlling turbid runoff during paddy puddling, and preventing soil erosion from upland fields, doubles as phosphorus control.
The volume of nitrogen humanity generates for agriculture has grown to a scale that is significant even geochemically. Since the Haber-Bosch process was established in the early 1900s, making it possible to synthesize ammonia industrially from atmospheric nitrogen, anthropogenic nitrogen fixation has expanded to rival natural fixation. In the planetary boundaries framework, which assesses the safe operating space for humanity across nine indicators, the biogeochemical flows of nitrogen and phosphorus are among the items judged to have exceeded their boundary — treated as a domain where the overshoot is as severe as climate change, or more so.
3. Livestock — how to cycle 80 million tonnes of manure a year
By the Ministry of Agriculture, Forestry and Fisheries' estimate, livestock in Japan produces roughly 80 million tonnes of manure a year (recent figures put it at about 78 million tonnes). Open-air piling and unlined pit storage once caused groundwater contamination, but management improved dramatically after the 1999 Livestock Manure Law (the Act on Appropriate Management and Promotion of Utilization of Livestock Manure), and most manure is now composted or converted to liquid fertilizer and returned to farmland.
"Composted, therefore safe," however, does not follow. In regions where livestock farming is concentrated, compost is produced beyond what local farmland can absorb and is applied repeatedly to the same fields, in some cases building up an excess of soil phosphorus. Accumulated phosphorus then continues to leave with turbid runoff for years afterward. How to balance the regional supply and demand of nitrogen and phosphorus — the material cycle within a region — determines the water environment of livestock districts.
4. Urban areas and the atmosphere — two routes easily overlooked
Dust settled on asphalt, fallen leaves, pet waste, tire wear particles. The first heavy rain after a dry spell washes all of it into rivers at once. This concentration of pollution at the start of a storm is called the first flush, and it forms the core of urban nonpoint loading. In areas served by combined sewers, another problem persists: during heavy rain, sewage that cannot be treated overflows with the stormwater and is discharged untreated.
Beyond that, nitrogen oxides from vehicles and factories and ammonia volatilized from barns and fertilizer travel through the atmosphere and fall on water bodies as wet and dry deposition. Some lands directly on the sea surface, a contribution that is far from negligible in inner bays. Treat a water problem as a matter of water alone and you will misread the answer.
| Route | Chemical form | Timing of discharge | Effective measures |
|---|---|---|---|
| Household wastewater | Ammonium nitrogen, organic nitrogen, phosphate | Roughly constant year-round | Advanced treatment in sewerage, conversion to combined septic tanks |
| Farmland | Nitrate nitrogen (dissolved), phosphorus adsorbed to soil particles | Concentrated just after fertilization and during rainfall | Optimized fertilization, buffer strips, turbid runoff control, cover crops |
| Livestock | Ammonia, organic nitrogen, phosphorus | Rainfall after compost application; leachate from storage facilities | Wide-area compost distribution, appropriate application, facility upgrades |
| Urban and atmospheric | Nitrate, ammonium, particulate organic matter | The first flush of a storm | Stormwater infiltration facilities, street cleaning, combined sewer improvement, air pollution control |
There are places where nitrogen is scarce
Across much of the open ocean, it is a shortage of nitrogen that limits phytoplankton growth. Nutrients are not in surplus across the ocean as a whole; the essence of eutrophication is that they are concentrated unevenly near the coast. That unevenness connects directly to the Seto Inland Sea's nutrient shortage, which we take up later.
How excess nutrients break the sea — a chain linked by time lags
Between the inflow of nutrients and the exhaustion of oxygen at the seafloor lie several stages and a lag of weeks to months. That cause and effect are so far apart in time is what makes this problem so easy to miss.
Stage 1: The explosive growth of phytoplankton
Ample nutrients, rising water temperature, strong sunlight, and weak winds that leave the water poorly mixed — when these conditions align, phytoplankton can multiply tens of times over within days. When density rises high enough to discolor the surface water, the result is what we call a red tide. Depending on whether dinoflagellates, diatoms, or raphidophytes dominate, the sea may turn reddish brown, muddy brown, or a shade of green.
Damage begins at this stage. Algae clog fish gills and suffocate them; some species release compounds toxic to fish; bivalves accumulate toxins and become unsafe to eat. For aquaculture, the blow is immediate. The mechanisms behind red tides and the damage recorded across Japan are covered in detail in Red tides, blue tides, and eutrophication.
Stage 2: Dead cells sink and decompose on the seafloor
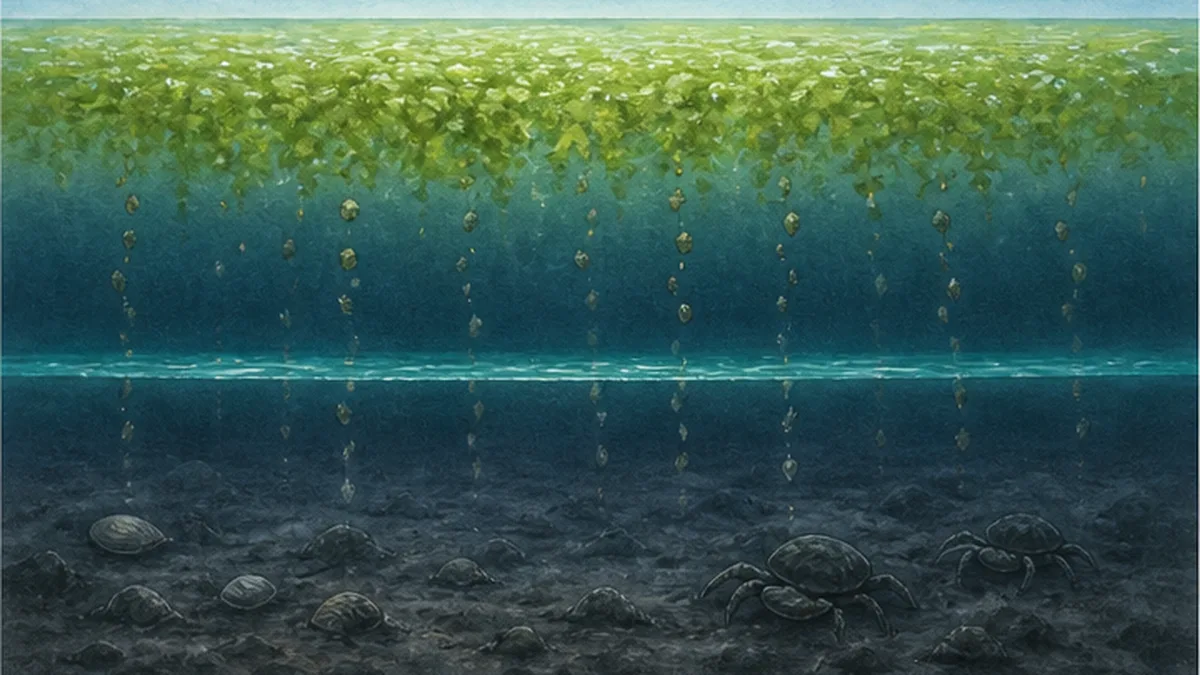
The plankton that bloom do not live long. Within days to weeks they die and sink as organic particles, together with the uneaten remains and fecal pellets of zooplankton. Bacteria then decompose that organic matter where it settles on the seafloor. Decomposition is an oxygen-consuming reaction, which means that the more plankton grow, the more oxygen the seafloor consumes.
A second condition compounds this. In summer, as the surface layer warms under the sun, a density difference forms between it and the cold, heavy bottom water, and the two stop mixing. This is stratification. With the surface — where oxygen enters from the atmosphere — cut off from the bottom layer that keeps consuming it, oxygen at the seafloor dwindles without replenishment.
Stage 3: Hypoxic water masses and dead zones
A water mass in which dissolved oxygen falls to roughly 2 mg/L or below is called a hypoxic water mass. NOAA uses this same 2 mg/L threshold to measure the Gulf of Mexico dead zone. Below that concentration, fish that can flee do so, while shellfish, polychaetes, crabs and other benthic organisms that cannot flee die. For creatures that cannot move, it is suffocation spreading in silence.
When oxygen disappears entirely, sulfate-reducing bacteria take over and hydrogen sulfide is produced. When wind drives this sulfide-bearing bottom water up along the coast, the sea turns a milky blue-white in what is known as a blue tide, killing shellfish in enormous numbers. It is a scene repeated from summer into autumn in Tokyo Bay and Mikawa Bay. The mechanisms of deoxygenation and the global distribution of dead zones are explored further in Ocean deoxygenation and the spread of dead zones.
The vicious circle that is hard to escape — release from bottom sediment
What makes this intractable is that a seafloor that has gone hypoxic begins to release nutrients on its own. In the presence of oxygen, phosphorus binds with iron and stays locked in the sediment. Once oxygen is gone, the iron is reduced, the bond breaks, and the stored phosphorus dissolves into the water. Nitrogen likewise returns from the sediment in the form of ammonia.
In other words, even if inflow from land is reduced, the "past loading" accumulated on the seafloor keeps supplying nutrients as an internal load. This is the single biggest reason eutrophication measures take so long to show results, and the reason many bays require decades of persistent effort.
Hard to see, and therefore late to act on
- A red tide is visible; a hypoxic water mass shows nothing at the surface
- Months separate the cause (spring inflow) from the effect (summer hypoxia)
- Nutrients accumulated in bottom sediment remain a source long after measures begin
- Damage starts with benthic organisms that cannot move. By the time it shows in catch statistics, it is already advanced
The world's dead zones — what the Gulf of Mexico and the Baltic Sea teach us
Eutrophication is not a uniquely Japanese problem. If anything, the vast overseas cases show the difficulty of watershed management in sharper relief.
The Gulf of Mexico — a map of hypoxia drawn on the sea by a continent's farmland
The Mississippi River gathers water from a basin covering roughly 40% of the continental United States and pours it into the Gulf of Mexico. That basin holds the Corn Belt, one of the world's great grain regions. When early-spring fertilization coincides with snowmelt and rain, vast quantities of nitrate nitrogen travel down the river and set off a phytoplankton bloom in the northern Gulf in early summer.
NOAA and partner institutions measure the area of that hypoxic water mass every summer. The survey conducted from July 20 to 25, 2025 recorded 4,402 square miles (about 11,400 km²) — the 15th smallest in 39 years of observation, and below the long-term average. Yet the figure is nothing to celebrate. The five-year average stands at 4,755 square miles, more than twice the 2035 target set by the Mississippi River/Gulf of Mexico Hypoxia Task Force (a five-year average below 1,900 square miles).
What that gap signifies is sobering. The United States has largely completed the upgrading of its sewage treatment plants; most of the remaining reduction potential lies in nonpoint loading from farmland. Even after decades of voluntary conservation programs stacked one on another, the distance to the target is still more than twofold. No figure speaks more eloquently of how hard nonpoint control is.
The Baltic Sea — nine countries dividing up national ceilings
The Baltic is a semi-enclosed sea with extremely limited water exchange with the open ocean. Its low-salinity surface layer and heavy deep water remain strongly stratified year-round, and the deep water is replaced only during major inflow events that occur once every several years to a decade or more. Geographically, it is among the most eutrophication-vulnerable seas in the world.
The Helsinki Commission (HELCOM), comprising the nine coastal states and the European Union, operates an ambitious framework under the Baltic Sea Action Plan (BSAP): it calculates a scientifically derived "maximum allowable input" (MAI) for each sub-basin and allocates it as national reduction obligations, or country-allocated input ceilings. It is an approach in which countries sharing one sea divide up the total load among themselves.
Results have followed. HELCOM's 2023 holistic assessment (HOLAS 3) reported that inputs of nutrients and hazardous substances had moved closer to balanced levels, an improvement over the previous assessment. Some countries have cut nitrogen inputs substantially from the reference period. Even so, the same assessment concluded that eutrophication remains one of the most serious challenges facing the Baltic ecosystem. The sea responds far more slowly than the measures do.
| Sea area | Main sources | Framework | Where it stands |
|---|---|---|---|
| Northern Gulf of Mexico (USA) | Farmland across the Mississippi basin (mainly nonpoint) | Mississippi River/Gulf of Mexico Hypoxia Task Force | 4,402 sq mi in 2025. Five-year average is more than twice the 2035 target |
| Baltic Sea (nine European states) | Farmland, household wastewater, atmospheric deposition | HELCOM Baltic Sea Action Plan (national input ceilings) | Inputs trending down, yet eutrophication remains the top challenge |
| Tokyo Bay, Ise Bay, Seto Inland Sea (Japan) | Mainly household wastewater, followed by industry and nonpoint sources | Total pollutant load control system (since 1979; now in its 9th round) | COD greatly improved. In some areas, nutrient shortage has become the issue instead |
The five-year average size of the dead zone is now 4,755 square miles, more than two times larger than the 2035 target.
NOAA National Centers for Coastal Ocean Science (measurement of the summer 2025 Gulf hypoxic zone)
Japan's half-century — the long experiment of total pollutant load control
Japan is one of the countries that led the world on eutrophication. Starting from the ferocious water pollution of the high-growth era, it has spent nearly fifty years shaving loads down. That history is a valuable record of both successes and side effects.
It began at Lake Biwa — the 1979 ordinance that led the world
In May 1977, a freshwater red tide erupted across Lake Biwa. Confronted with foul-smelling reddish-brown water, and learning that one cause was the phosphorus in synthetic detergents, residents of Shiga Prefecture launched what became known as the "soap movement" — a campaign, born on the side of daily life, to stop using phosphorus-containing detergents and switch to powdered soap made from natural fats and oils.
Against that backdrop of civic action, Shiga Prefecture enacted the Ordinance on the Prevention of Eutrophication of Lake Biwa in 1979. Beyond imposing nitrogen and phosphorus effluent standards on factories and business establishments, it banned the sale and use of phosphorus-containing synthetic detergents and covered the appropriate use of fertilizer and the proper handling of livestock manure. As an effluent regulation targeting nitrogen and phosphorus it was the first in Japan and a pioneering measure by world standards.
What the Biwa ordinance demonstrated is that combining regulation with changes in everyday habits does improve water quality. It is still cited as the origin point of Japanese water environment policy.
Total load control — from concentration limits to total quantity limits
Regulating the concentration of each individual outfall does nothing to reduce the total entering a bay if the number of dischargers grows. Recognizing this limit, the 1978 amendment to the Water Pollution Control Act introduced the total pollutant load control system. It designates three enclosed sea areas — Tokyo Bay, Ise Bay, and the Seto Inland Sea — and sets targets for reducing the total pollutant load flowing in from designated areas.
At first only COD was covered. From the fifth round in 2001, nitrogen and phosphorus were added, making it a system that confronts eutrophication head-on. The national government sets a basic policy for total load reduction, prefectures draw up reduction plans, and total load control standards apply to individual establishments. The system is reviewed roughly every five years and is now in its ninth round.
The reduction targets set out by the Ministry of the Environment for the ninth round are shown below (in tonnes per day, with FY2019 actual figures and FY2024 targets). Reading the table reveals what the system is now trying to do.
| Sea area | Item | FY2019 actual | FY2024 target |
|---|---|---|---|
| Tokyo Bay | COD | 154 | 150 |
| Tokyo Bay | Nitrogen | 162 | 159 |
| Tokyo Bay | Phosphorus | 12.1 | 11.8 |
| Ise Bay | COD | 131 | 127 |
| Ise Bay | Nitrogen | 106 | 106 |
| Ise Bay | Phosphorus | 8.0 | 7.9 |
| Seto Inland Sea | COD | 374 | 372 |
| Seto Inland Sea | Nitrogen | 380 | 389 |
| Seto Inland Sea | Phosphorus | 24.3 | 24.6 |
Tokyo Bay and Ise Bay continue to reduce, while for the Seto Inland Sea nitrogen goes from 380 to 389 and phosphorus from 24.3 to 24.6 — targets larger than the actuals. This is not a misprint. These numbers show a system that has turned toward "reduce no further," and they are a declaration that Japanese eutrophication policy has entered a new phase.
What changed in fifty years
Compare the system's early days with today and the achievement is unmistakable. According to Ministry of the Environment materials, the COD load to Tokyo Bay fell from 477 tonnes/day in FY1979, when total load control began, to 154 tonnes/day in FY2019 — a 68% reduction. Effluent regulation of factories and the rapid build-out of sewerage did the work. Red tide occurrences in the Seto Inland Sea likewise declined from a peak of 299 in 1976, and recent years have run consistently below 100. As a policy instrument, it belongs firmly in the successful category.
But the increments are shrinking. As the ninth-round targets show, the COD reduction for Tokyo Bay is from 154 to 150 — a mere 4 tonnes/day. The cheap, large cuts have already been made. Taking out the next tonne requires the investment and coordination that once bought ten. And what remains is nonpoint loading with no identifiable responsible party, discharged unpredictably at the mercy of the rain. Japan, too, stands before the same wall as the Gulf of Mexico and the Baltic Sea.
Fifty years of Japanese water policy
- 1970: Water Pollution Control Act enacted, curbing factory effluent through concentration limits
- 1977: A major freshwater red tide in Lake Biwa spurs the soap movement
- 1978: Amendment of the Water Pollution Control Act introduces total load control (COD only)
- 1979: Shiga Prefecture enacts the Lake Biwa ordinance — Japan's first nitrogen and phosphorus effluent regulation
- 1999: Livestock Manure Law ends open piling and unlined pits in favor of composting
- 2001: Nitrogen and phosphorus added from the fifth round of total load control
- 2021: Amendment of the Act on Special Measures concerning Conservation of the Environment of the Seto Inland Sea creates the nutrient management system
The paradox of a sea that is "too clean" — the Seto Inland Sea changes course
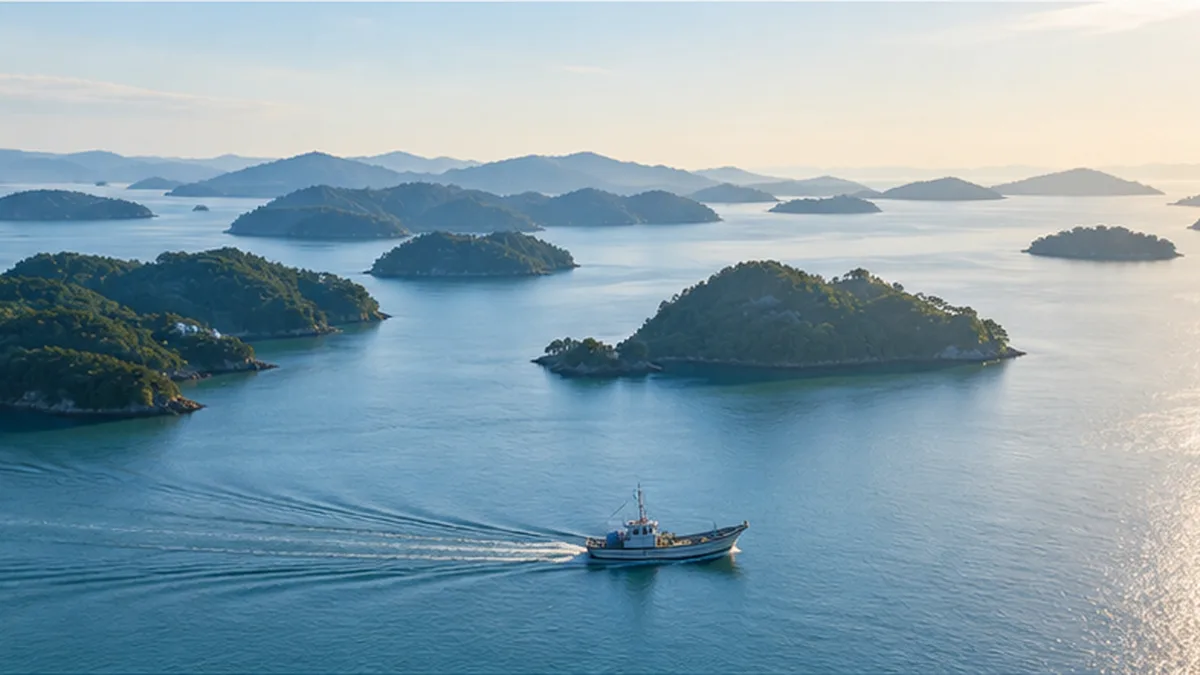
The Seto Inland Sea, once called a dying sea, improved dramatically under strict effluent regulation and total load control. Transparency rose, and large-scale red tides fell to a fraction of their former frequency. And then, beyond that point, a problem no one had anticipated came into view.
When nori loses its color
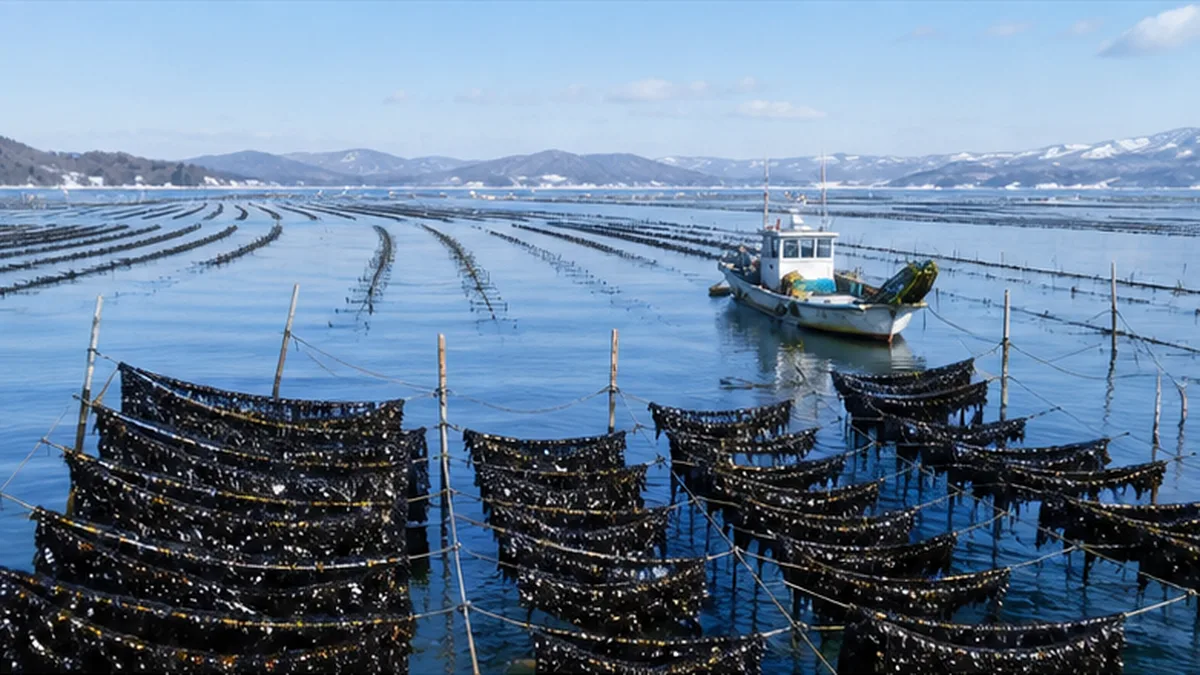
Farmed nori seaweed takes up dissolved inorganic nitrogen (DIN) from seawater to build its photosynthetic pigments. Starved of nutrients, those pigments fade, and the blade loses its deep black luster for a thin, reddish tone. This is color fading. Faded nori loses flavor and aroma as well, and its market value falls sharply.
In the nori grounds of the Seto Inland Sea and the Ariake Sea, this fading became a serious problem in winter. The causes are not singular: rising water temperature shifting the growing season, competition for nutrients with phytoplankton, and a decline in the DIN concentration of the sea area itself all interlock. The reality confronting policymakers was that a sea made clean was not necessarily a sea made rich.
The 2021 amendment — from a system that reduces to a system that manages
In June 2021, the Act on Special Measures concerning Conservation of the Environment of the Seto Inland Sea was amended to create a nutrient management system. Under it, prefectural governors may adopt a "nutrient management plan" that allows nutrients to be supplied to specified sea areas in specified seasons, within the bounds of environmental quality standards. It is a shift from a system that reduces uniformly to a system that adjusts by place and by season.
The Ministry of the Environment issued guidelines for drawing up such plans in March 2022, and in October of the same year Hyogo Prefecture became the first among the relevant prefectures to adopt a nutrient management plan. Kagawa, Okayama, Yamaguchi and others followed, setting targets, measurement methods, and monitoring arrangements for each sea area.
"Seasonal operation" at sewage treatment plants — ingenuity on the ground
The concrete technique underpinning these plans is nutrient management operation, or seasonal operation, at sewage treatment plants. Plants that normally run to strip out as much nitrogen as possible deliberately raise the nitrogen concentration of their effluent during the winter nori season by moderating nitrification or denitrification. In summer they return to high removal rates, avoiding the risk of red tides and hypoxia.
Hyogo Prefecture was the first in Japan to write seasonal total-nitrogen water quality targets into its sewerage plan, for the Harima-nada area. As of 2016, twenty treatment plants in the prefecture were carrying out nutrient management operation centered on the nori season, and nori grown in coastal grounds nearer the outfalls showed a tendency toward better color than that grown offshore. Along the Ariake Sea, Saga Prefecture and others have pursued similar joint research.
That said, it is a tightrope. Operating to raise nitrogen tends to raise BOD (biochemical oxygen demand) as well, and a misjudged adjustment could bring back red tides and hypoxia. That is precisely why the plans embed compliance with environmental standards and continuous monitoring, and call for adaptive management. Once people actively intervene in the sea's nutrient balance, the responsibility to keep measuring the results comes with it.
The idea that human intervention can make a sea richer resonates with the philosophy of satoumi, nurtured in the Seto Inland Sea. Rather than protecting by keeping away, one sustains abundance by staying involved. The nutrient management system can be read as an attempt to give that idea legal form.
What this shift tells us
- Water quality targets cannot be measured by "cleanliness" alone; an axis of biological production is needed
- The appropriate nutrient level differs by sea area and by season
- Alongside the technology to reduce, we need the technology to supply when needed — and the consensus to do it
- Once we intervene, monitoring and course correction (adaptive management) become indispensable
Cutting loads across the watershed — sewerage, septic systems, and farmland
So where does room for further reduction lie? Beyond the exhausted point sources, what remains is unglamorous, slow, and nonetheless reliably effective.
Advanced treatment in sewerage systems
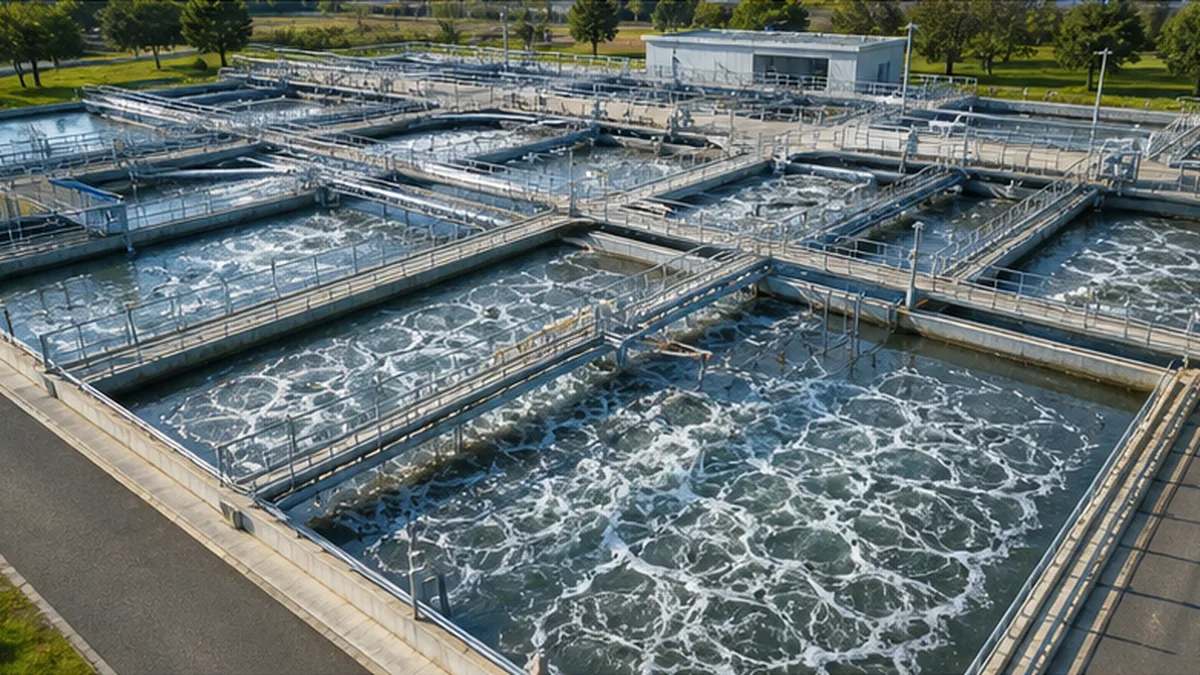
The standard activated sludge process excels at removing organic matter but leaves much of the nitrogen and phosphorus behind. Combining anaerobic and aerobic tanks to drive nitrification and denitrification removes nitrogen; enhanced biological phosphorus removal makes microorganisms take up phosphorus in excess; coagulants strip it chemically. Introducing such advanced treatment can bring effluent nitrogen and phosphorus down substantially.
The obstacles are cost and time. Retrofitting existing facilities requires major investment and increases energy consumption. Much of Japan's sewerage infrastructure is reaching the end of its service life, and how to pursue renewal and advanced treatment at once has become a heavy assignment for municipal finances. In regions with declining populations it becomes a double bind: right-sizing facilities while raising the level of treatment.
In recent years there has also been a move to see sewage sludge, the byproduct of treatment, as a resource. Sludge concentrates nitrogen and phosphorus, and recovering it as fertilizer reduces what is discharged to the sea while circulating domestically a phosphorus supply that Japan otherwise imports. Discharged to the sea it is a pollutant; returned to the field it is fertilizer — the plain fact that the same substance changes value with the place it is put is reshaping how measures are designed.
Septic tanks — from single-purpose to combined, and on to advanced treatment
Areas beyond the reach of sewerage rely on septic tanks. A single-purpose tank, which treats only toilet waste, discharges kitchen, bath, and laundry water untreated. New installation is now banned in principle, but many existing units remain across the country, and the Ministry of the Environment and municipalities are supporting conversion to combined treatment tanks through subsidy programs.
To go further and target nitrogen and phosphorus, there are advanced combined treatment tanks, which use anaerobic filter beds to let denitrifying bacteria work and iron electrodes to remove phosphorus chemically. In watersheds feeding enclosed water bodies, a growing number of municipalities are adopting these as standard. The effect per unit is small, but tens of thousands of units across a watershed add up to a quantity that cannot be ignored.
Farmland — reducing inputs and retaining outputs
Farmland measures rest on two pillars. The first is optimizing what goes in: fertilization designed on soil diagnosis, split applications timed to crop demand, controlled-release coated fertilizers, localized placement. Ending over-application cuts environmental loading and production costs at the same time.
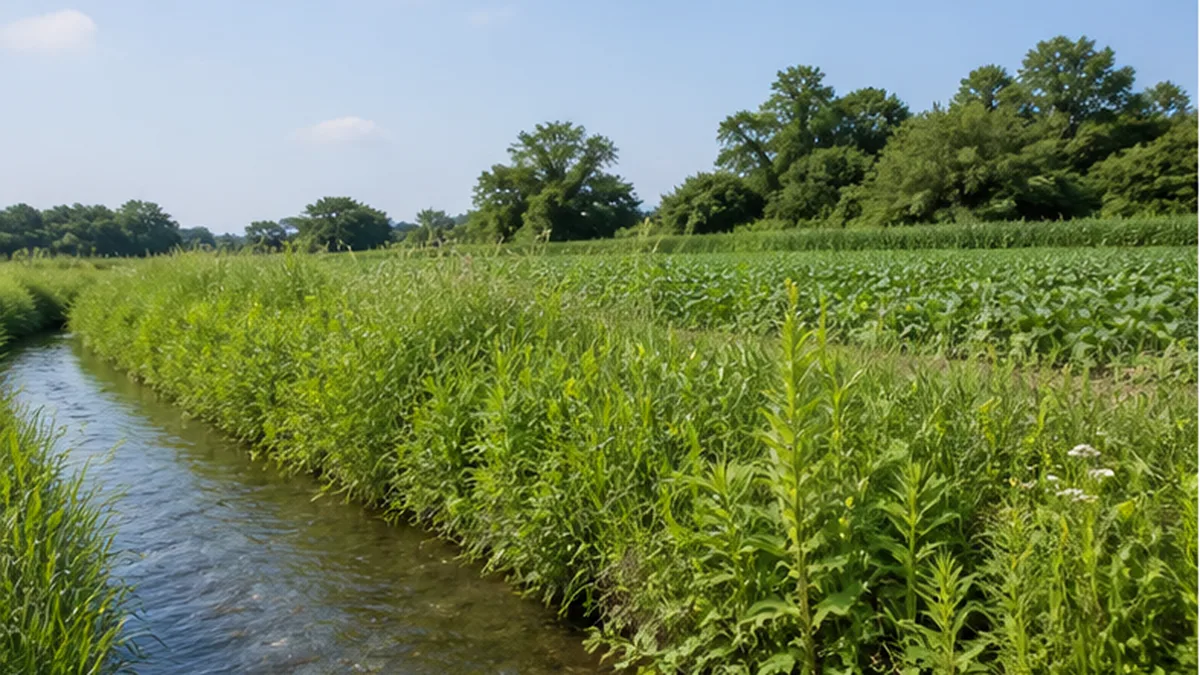
The second is retaining what would otherwise leave. Placing a buffer zone of grass or trees between fields and waterways intercepts turbid runoff and nutrients. Sowing cover crops such as rye or hairy vetch on fields left bare over winter takes up surplus nitrogen and prevents soil loss. In paddy areas, improved water management during puddling to curb turbid runoff is spreading.
On the policy side, the MIDORI Strategy for Sustainable Food Systems, adopted by the Ministry of Agriculture, Forestry and Fisheries in 2021, sets targets of cutting chemical fertilizer use 30% by 2050 and expanding organic farming to 25% of cultivated area (one million hectares). The strategy also includes a 50% reduction in chemical pesticide use on a risk-weighted basis and zero-emission status for agriculture, forestry and fisheries. With fertilizer prices high, the review of fertilization is advancing on both environmental and business grounds, together with wider use of compost and sludge-derived fertilizer.
Livestock — building a system that does not leave manure in surplus
Composted appropriately, the roughly 80 million tonnes of livestock manure produced each year is an indispensable resource for building soil, and it contributes to soil carbon storage as well. The problem is its uneven distribution. Compost is in surplus where livestock farming is concentrated and scarce where crop farming relies on chemical fertilizer. To resolve that mismatch, efforts are underway to pelletize compost for wide-area distribution, match livestock and crop farmers, and market compost as products with guaranteed nutrient content.
Urban areas and stormwater — catching the first flush
In urban areas, green infrastructure such as infiltration basins, permeable pavement, and rain gardens lets stormwater soak into the ground and softens the surge of road pollution into rivers. Improving combined sewers — building stormwater retention basins and increasing interception capacity — is a direct measure against untreated overflow. These same measures also reduce the risk of urban flooding.
| Measure | Main target | Expected effect | Challenges |
|---|---|---|---|
| Advanced treatment in sewerage | Household and industrial effluent (point source) | Large reductions in nitrogen and phosphorus; reliable and measurable | Retrofit cost and energy use; competing with renewal needs |
| Conversion to combined septic tanks | Household wastewater beyond sewerage areas | Eliminates untreated discharge of gray water | Cost to households, resident understanding, renewal in aging communities |
| Optimized fertilization | Farmland (nonpoint) | Cuts loading and costs together | Concern over yields; need for extension support |
| Buffer zones and cover crops | Farmland (nonpoint) | Intercepts nutrients and soil en route | Loss of planted area; management labor |
| Wide-area compost distribution | Livestock (nonpoint) | Improves the material cycle within a region | Transport costs; variable quality |
| Infiltration and green infrastructure | Urban areas (nonpoint) | Softens the first flush; also aids flood control | Securing land; maintenance |
The dinner table, the detergent, and the watershed — the choices on our side
Eutrophication is not a matter for government, farmers, and businesses alone. As the Lake Biwa soap movement showed, this country also has a precedent in which change on the side of daily life moved the institutions.
What leaves the kitchen
Within household wastewater, the kitchen is said to carry the largest pollutant load. Cooking oil poured away unused, sauce and soup left on plates, food scraps rinsed down the drain — all enter the sewer as organic matter and as a source of nitrogen and phosphorus. Small habits such as wiping plates with paper before washing and never pouring oil down the drain reliably lighten the load on treatment plants.
As for detergents, phosphorus-containing laundry detergents for household use have essentially disappeared from Japan. Some dishwashing detergents, certain commercial products, and some imports still contain phosphates, however, so the habit of reading ingredient labels is not wasted.
How we eat determines the watershed's nitrogen
It may look like a detour, but reducing food loss is also reducing nitrogen and phosphorus loading. The fertilizer and feed used to produce food that is thrown away is environmental loading incurred for nothing. Livestock products carry a larger nitrogen input because of the feed crops required, so how a diet is composed also registers in a watershed's nitrogen balance.
At the same time, choosing produce grown with environmental care supports the producers making the effort. Organic produce, certification for environmentally conscious farming, produce grown with locally cycled compost — such choices at the shelf give farmers the push to rethink their fertilization.
Seeing the watershed as your own place
Surprisingly few people know which river basin they live in, or which sea that river empties into. Yet eutrophication happens precisely along those lines. Look up water quality data for your local river, join a river or beach cleanup, sit in on a local water environment meeting. Not seeing land and sea as separate things may be the most fundamental stance an individual can take toward this problem.
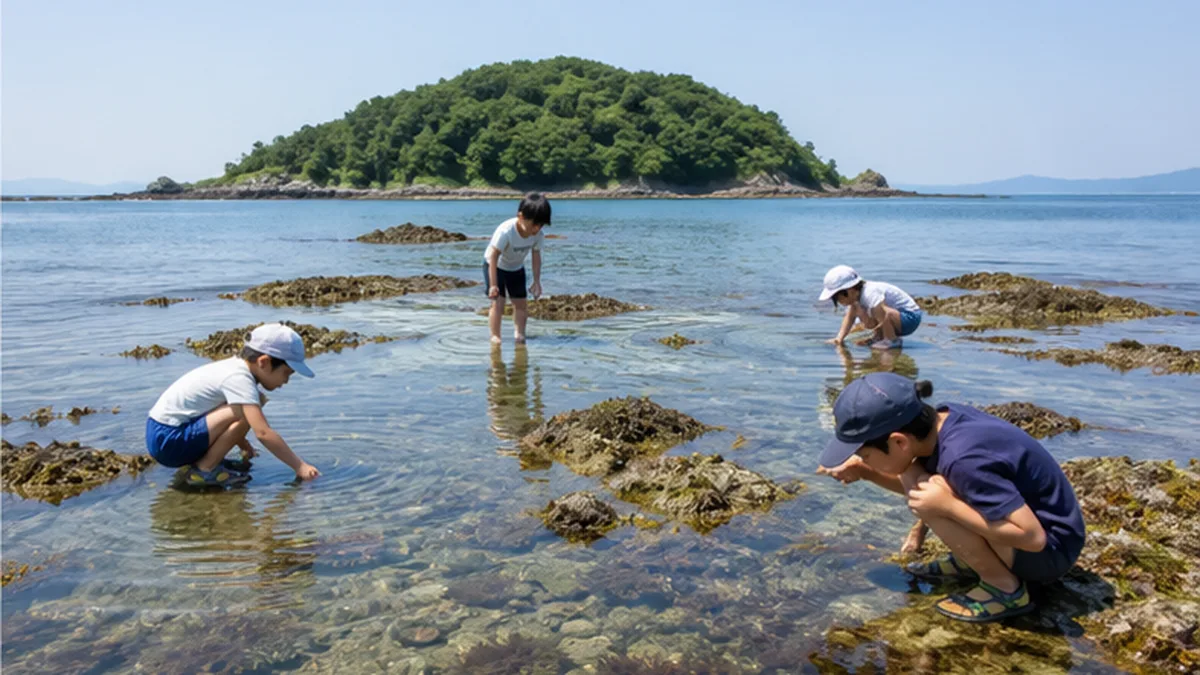
And one more thing worth remembering. Discussion of eutrophication tends to become a discussion of crisis, but the purpose beyond it is to restore a rich sea. Nori with deep black luster, clams returning to the tidal flats, inner bays busy with fish. What the Seto Inland Sea's nutrient management system aims at is not a sea without impurity but a sea crowded with life. Reduction is a means, not an end.
What you can do today
- Wipe oily dishes with paper before washing. Never pour cooking oil down the drain — solidify it or take it for collection
- Check detergent ingredient labels and avoid using more than needed
- Cut food loss. Don't over-buy; use what you have
- If your home uses a single-purpose septic tank, look into subsidies for converting to a combined treatment tank
- Find out on a map which river basin your home sits in and which sea that river reaches
- Join a local river or beach cleanup, or a water quality monitoring effort
References and sources
- Ministry of the Environment, Japan – Adoption of the basic policy for total reduction of chemical oxygen demand, nitrogen and phosphorus (Tokyo Bay, Ise Bay and the Seto Inland Sea), 9th round
- Ministry of the Environment, Japan – Guidelines for the preparation of nutrient management plans (March 2022)
- Ministry of the Environment, Japan – Basic Plan and Act on Special Measures concerning Conservation of the Environment of the Seto Inland Sea (2021 amendment / nutrient management system)
- Ministry of Land, Infrastructure, Transport and Tourism, Japan – Wastewater treatment coverage at the end of FY2024 (coverage rate 93.7%)
- Ministry of Agriculture, Forestry and Fisheries, Japan – Adoption of the MIDORI Strategy for Sustainable Food Systems (30% reduction in chemical fertilizer use by 2050)
- Ministry of Agriculture, Forestry and Fisheries, Japan – Generation and management of livestock manure (about 80 million tonnes per year)
- NOAA National Centers for Coastal Ocean Science – Below Average Summer 2025 'Dead Zone' Measured in Gulf (4,402 square miles in 2025)
- HELCOM (Helsinki Commission) – Nutrient input reduction scheme (maximum allowable inputs and national input ceilings under the Baltic Sea Action Plan)
- Shiga Prefecture – Institutional design and initiatives for conserving the water environment of Lake Biwa (1979 Lake Biwa Eutrophication Prevention Ordinance)
- Hyogo Prefecture – Hyogo Prefecture Nutrient Management Plan: toward a rich and beautiful satoumi (adopted October 2022)
Sources are ordered by reliability: government and academic institutions > peer-reviewed papers > specialist bodies > trusted media