⚡ The answer in 30 seconds
- Fish freshness is determined by ATP breakdown after death; the smaller the K value the fresher the fish, and 20% or less is the guideline for raw eating.
- The FAO estimates that up to about 35% of global fisheries and aquaculture output is lost.
- The best way to slow spoilage is an unbroken low-temperature chain (the cold chain) from the moment of landing.
- While considering the energy cost of cooling, buying and storing wisely at home so food is eaten up also matters.
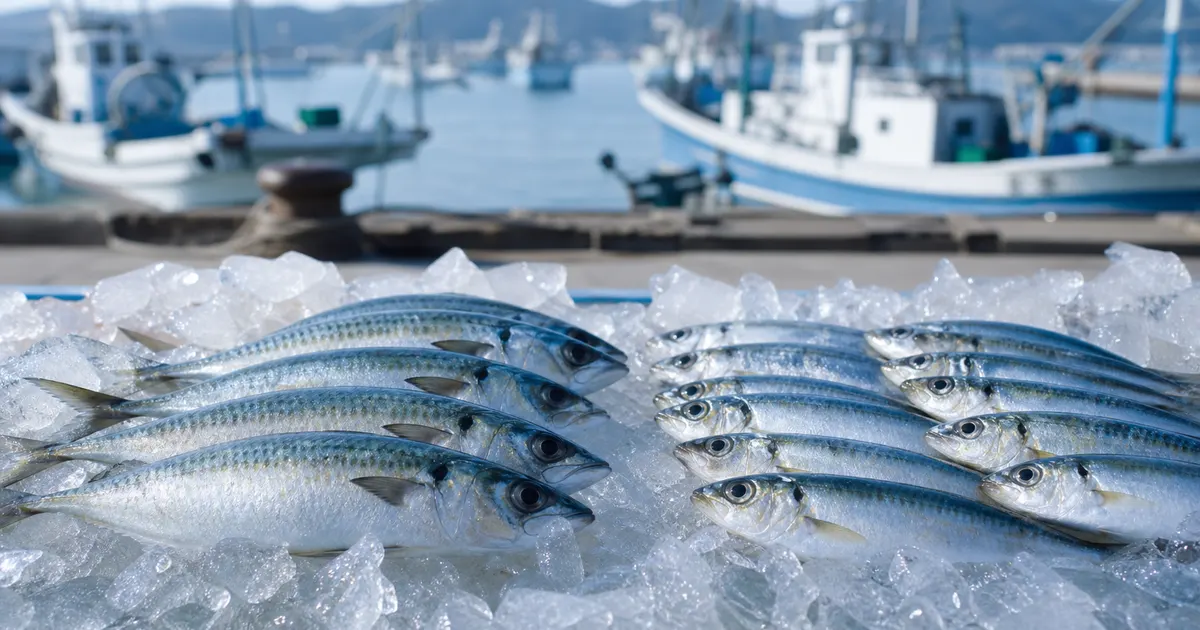
Put two fish in the same refrigerator and one may lose its flavor by tomorrow while the other stays delicious for days. The difference comes from chemical changes after death and from how the temperature is managed.
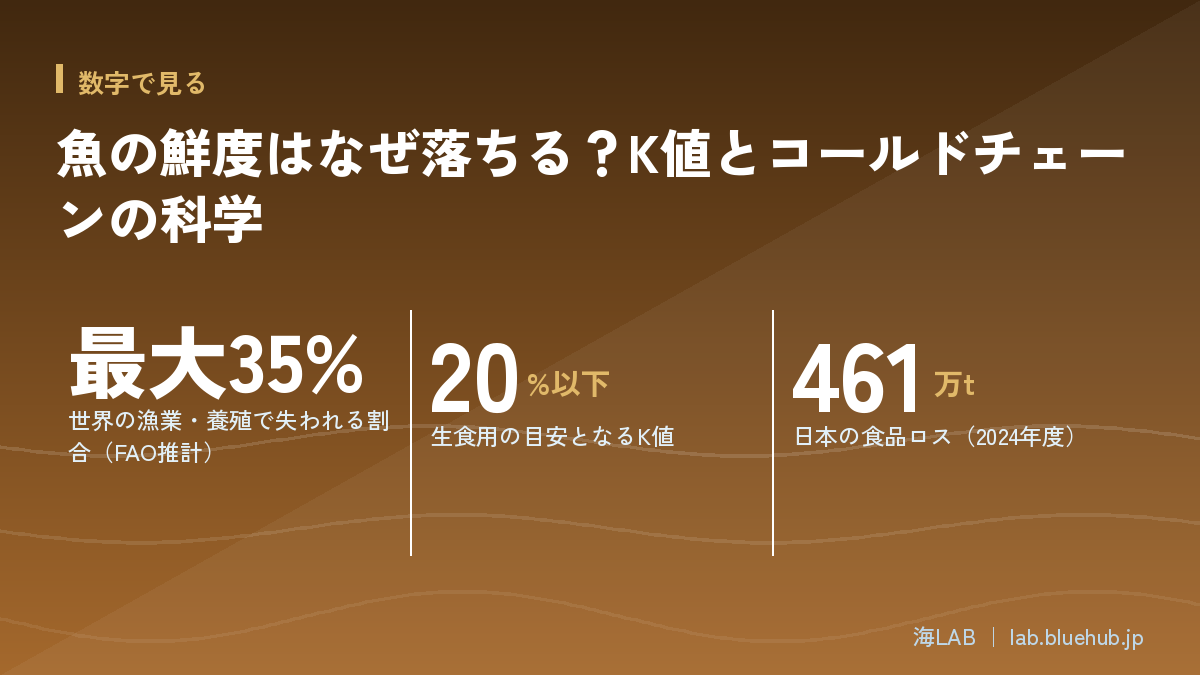
The Food and Agriculture Organization of the United Nations (FAO) estimates that up to about 35% of global fisheries and aquaculture output is lost or wasted every year. Japan's food loss is about 4.61 million tonnes a year. An official figure for seafood alone could not be confirmed, but because fish spoil easily, technologies that keep them fresh matter a great deal.
This article explains, based on primary sources, the science of why fish lose freshness, how ice storage and freezing work, distribution and regulation, and what households can do.
What You Will Learn
- How much seafood is lost in the world and in Japan
- How post-mortem changes and the K value measure freshness
- Features of ice storage, seawater slurry ice and rapid freezing
- The role of HACCP and temperature monitoring
- The energy cost of cooling and what households can do
Where Seafood Loss Occurs | Numbers from the World and Japan
Up to 35% of the world's catch and farmed fish is lost
The FAO estimates that up to about 35% of fisheries and aquaculture output is lost or wasted every year. That is roughly one in three fish never reaching the table. Causes differ by region: in Africa and Latin America the main reasons are a lack of ice, refrigeration, transport and preservation know-how. In wealthier countries, waste in the later stages of distribution and at the consumption stage, such as unsold or uneaten fish, stands out.
Target 12.3 of the UN Sustainable Development Goals (SDGs) calls for halving per capita food waste at the retail and consumer level by 2030 and reducing food losses along production and supply chains, including post-harvest losses. Fish are a typical perishable food, so technologies that cool and keep them fresh play a large role in reaching this target.
Japan's food loss is 4.61 million tonnes a year
According to estimates by the Ministry of Agriculture, Forestry and Fisheries and the Ministry of the Environment, Japan's food loss in fiscal 2024 was about 4.61 million tonnes (about 4.64 million tonnes the previous year). Of this, about 2.37 million tonnes came from businesses and about 2.24 million tonnes from households. The government aims to cut business food loss by 60% from the fiscal 2000 level, and the reduction was reported as 57.8% as of fiscal 2023. These are figures for food as a whole, however. An official quantity for fish and shellfish alone cannot be confirmed from published materials at present. This article therefore does not assert a seafood-specific figure and instead reads the mechanisms from FAO estimates and domestic research reports.
| Indicator | Figure | Source |
|---|---|---|
| Share of global fisheries and aquaculture lost or wasted | Up to about 35% | FAO |
| Japan's food loss (FY2024) | About 4.61 million tonnes | Ministry of Agriculture, Forestry and Fisheries / Ministry of the Environment |
| of which business / household | About 2.37 million / about 2.24 million tonnes | Same as above |
| Per capita consumption of edible fish and shellfish (FY2023, net food basis) | 21.4 kg (down from 40.2 kg in FY2001) | White Paper on Fisheries |
| Self-sufficiency rate for edible fish and shellfish (FY2024 estimate, weight basis) | 52% | Fisheries Agency |
Key points of this section
- Worldwide, up to about 35% of catch and farmed output is estimated to be lost
- Japan's overall food loss is 4.61 million tonnes, but an official figure for fish and shellfish alone could not be confirmed
- Consumption of edible fish and shellfish is declining, so using limited resources without waste matters
Why Do Fish Spoil So Easily? | Post-mortem Changes and the Science of the K Value
Three changes after death
When a fish is landed and dies, a series of chemical changes proceeds inside its body. Broadly, the order is: ATP, the energy source of muscle, decreases and rigor mortis sets in; ATP breaks down and the umami compound inosinic acid increases; then breakdown goes further, freshness drops and bacteria multiply. ATP is broken down step by step: ATP → ADP → AMP → inosinic acid (IMP) → inosine (HxR) → hypoxanthine (Hx).
A study by Chiba Prefecture reported a case in which inosinic acid, about 40% of ATP-related compounds just after catch, rose to over 80% after 18 hours. In other words, some species gain umami if left a little while rather than eaten freshly caught. This is an example that varies by species and conditions, and it does not mean that more time is better. After umami peaks, breakdown into inosine and hypoxanthine advances, and both taste and freshness decline.
The K value: freshness as a number
The index that measures freshness objectively is the K value. It is the percentage of inosine (HxR) and hypoxanthine (Hx) in the total of ATP and its breakdown products; the smaller the value, the fresher the fish. Fisheries materials from Shimane Prefecture and others give K value of 20% or less as the guideline for raw consumption. Kyoto Prefecture's materials organize 20–50% as a guideline for cooked use and 60% or more as spoiled and unfit to eat. Measurement uses HPLC (high-performance liquid chromatography), and this method was established as a JAS standard in March 2022.
| K value guideline | Condition | Main use |
|---|---|---|
| 20% or less | Very fresh | Raw (sashimi) |
| 20–50% | Freshness starting to decline | For cooking |
| 60% or more | Spoilage advanced | Unfit to eat |
Spoilage speed differs greatly by species
Even with the same ice storage, how fast fish spoil varies widely by species. A Kyoto Prefecture report found that cod-family fish reached a K value of 60% after 2–3 days of ice storage, whereas red sea bream stayed below 40% even after 16 days. Some fish, such as swordfish, easily exceed the 20% standard. So "how many days will a fish keep" cannot be set uniformly. To cut losses, the strength of temperature control has to be varied by species.
Note
- The K value is a guideline for suitability for raw eating and is a separate yardstick from food safety (the risk of food poisoning)
- Some regard rigor mortis as a sign of freshness, while other researchers see the fall in ATP that causes rigor as the progress of freshness loss; interpretations differ
Temperature Is Still the Basics | Ice Storage, Seawater Ice and Low-temperature Handling
Why lower temperatures slow spoilage
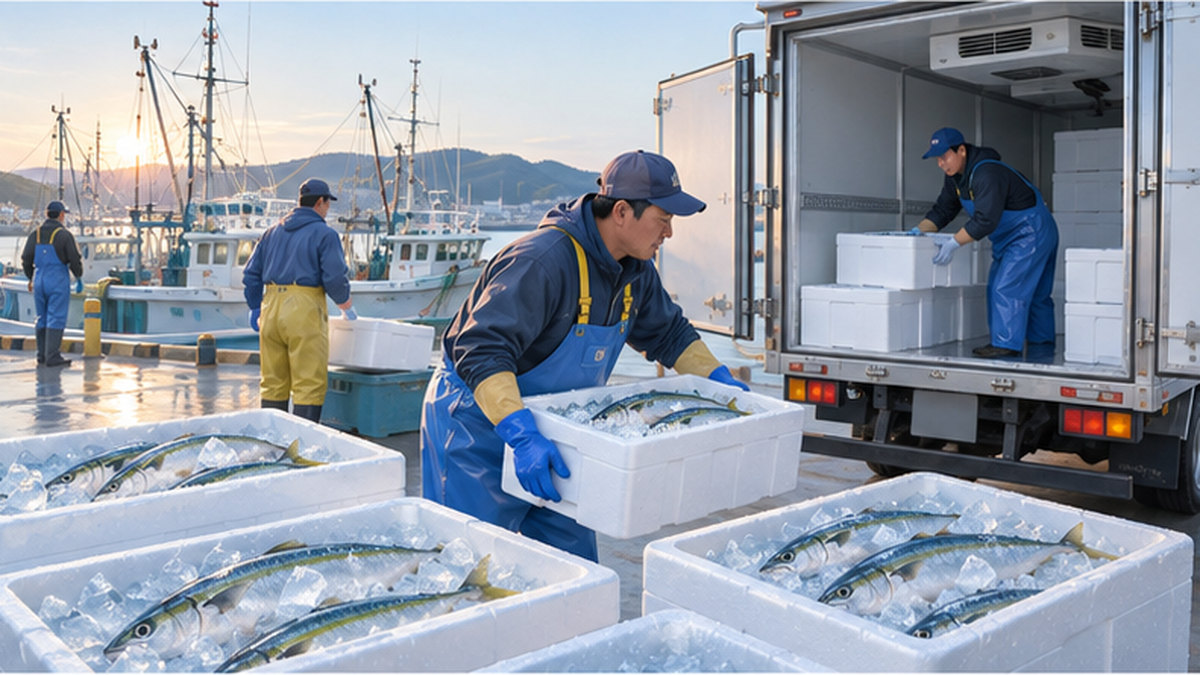
How fast fish lose freshness depends on enzyme activity and bacterial growth. Both slow down at lower temperatures, so cooling from the moment of landing is the single most effective measure. Conversely, if the temperature rises at even one point from catch through market, processing, retail and home, freshness drops sharply there. The "cold chain" is the idea of never breaking this chain of low temperature.
A 2022 report by the FAO and UNEP pointed out that the lack of effective refrigeration led to the loss of 12% of the world's food production in 2017. It also states that the whole food cold chain accounts for about 4% of global greenhouse gas emissions. Cooling reduces food loss, but the energy it uses also creates emissions, so it cuts both ways. The decarbonization side is covered in Decarbonizing the Seafood Cold Chain.
Seawater slurry ice as an option
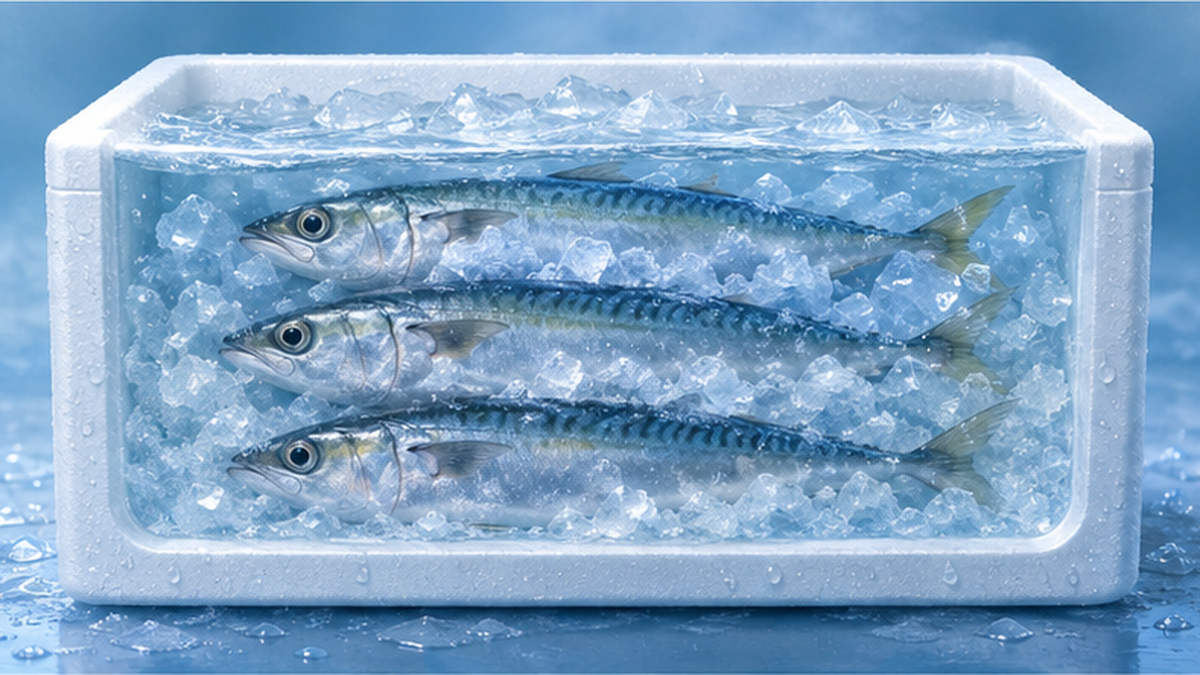
One coolant used on fishing boats and at landing-site markets is slurry ice, made by freezing seawater into a sherbet-like slush. In materials on a Hokkaido fisheries test, storing flathead flounder (Sohachi) in seawater ice kept the body temperature lower than freshwater cube ice, and the rise in K value was slower. A Tokushima Prefecture document also shows a case in which kuruma-type shrimp (Ashiaka ebi) immersed alive in slurry ice kept their red color after 24 hours. Because the fine particles cling to the fish without gaps, they are also said to cool evenly.
It is not a cure-all, however. A conference presentation from Hokkaido noted that for fish such as walleye pollock, the body can freeze depending on conditions, so overcooling becomes a problem. Adjusting ice temperature and immersion time to each species is a prerequisite.
Which temperature range is the standard?
Industry materials give guideline storage temperatures of 10°C or below for chilled and −15°C or below for frozen. For frozen foods, a voluntary handling standard of storing and distributing at −18°C or below is widely used. At sites that handle raw seafood, however, management at lower, near-ice temperatures is generally practiced. These are not all statutory values and some are operational guidelines, so actual handling requires checking product labels and trading-partner standards.
- Start cooling immediately after landing and do not let the temperature rise
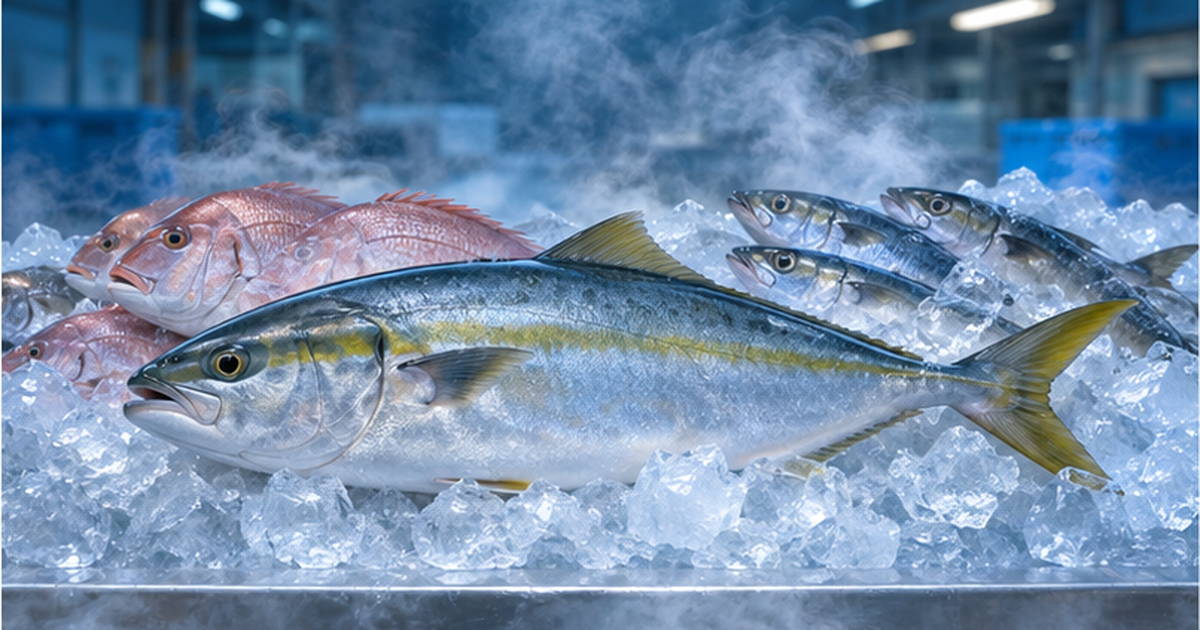
- Layer ice and fish alternately so that ice touches the whole body
- Record and check the temperature at each stage: market, transport, store and home
Freshness Changes with How Fish Are Killed and Handled | Ikejime, Nerve Destruction and Bleeding
A little extra care after catch makes the difference
Treatment before cooling also affects how long freshness lasts. When a fish thrashes in distress it uses up its ATP, rigor mortis starts earlier and freshness falls sooner. So handling such as ikejime (quickly stopping movement), nerve destruction (shinkeijime, damaging the spinal cord to suppress muscle response) and bleeding (reducing off-odor and a cause of deterioration) is carried out.
In a Kyoto Prefecture study of Akagarei (flatfish), the group whose spinal cord was destroyed kept a high inosinic acid ratio of 83% after 12 hours and 82% after 30 hours. This is an example in which ATP declined slowly and the umami state was maintained longer. It is a report for one species, though. Whether the same effect appears in other fish is not guaranteed, so verification by species is needed.
Added value and waste reduction are connected
Carefully handled fish not only stay fresh longer but also tend to sell at higher prices. If the risk of unsold stock falls, waste falls. Conversely, fish distributed cheaply in large volumes are harder to handle with care and are structurally prone to loss. How to bridge this contradiction through producers' efforts and distribution systems is the challenge. Efforts to use non-standard and unused fish are introduced in Using Unused Fish.
Caution
- The effect of killing methods varies by species, size and water temperature. Do not generalize research examples as they are
- If done at home, a wrong procedure can damage the flesh or cause hygiene problems
Freezing as a Preservation Technology | The Tug-of-war Between Ice Crystals and Quality
Why rapid freezing is emphasized
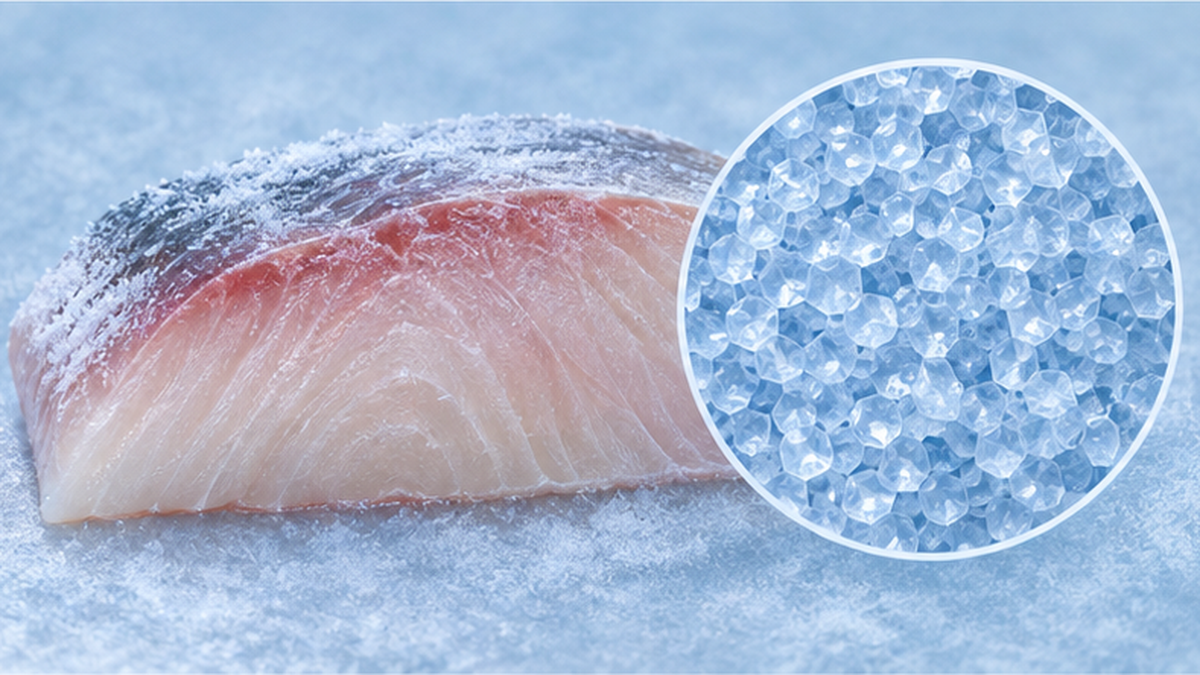
The key to long-term storage is freezing. Freezing nearly stops bacteria and enzymes, so it can greatly reduce waste. But slow freezing lowers quality. When water turns to ice, especially many ice crystals form in the −1 to −5°C range (the zone of maximum ice crystal formation). Passing slowly through this zone lets crystals grow large and damage cells and tissue, so the juice that carries umami (drip) leaks out on thawing.
Materials from the Abashiri Fisheries Research Institute summarize that rapid freezing is desirable to keep fish quality and that the storage temperature after freezing should be as low as possible. Materials from the Tokyo University of Marine Science and Technology report that freezing at −20°C took about 60 minutes to pass through this zone. This is why technology development for shortening the passage time with lower-temperature freezing is advancing.
Benefits and limits of freezing
- Benefits: storage time lengthens greatly, and fish caught in season can be distributed all year. It smooths out supply and demand swings and reduces waste of surplus
- Limits: if freezing or thawing conditions are poor, quality drops, and as a result the price falls or the fish are discarded
- Caution: refreezing fish once thawed harms quality and should be avoided
Using freezing is also central to seafood food loss overall. For how loss arises at markets and retail, see also Fish Food Loss: What Happens at Markets and Retail.
What Happens in Distribution | Causes of Loss at Markets, Logistics and Retail
Weaknesses of multi-stage distribution
A Fisheries Agency case collection explains that Japan's seafood distribution is a multi-stage type in which individual specialist businesses handle production, processing and distribution, with wholesale markets as the mainstream. This system can deliver a wide variety of wild fish quickly while keeping them fresh, but it is also pointed out to be weak in creating added value that matches market needs and in passing on information. When information is cut off, volumes that do not match demand are shipped, leading to unsold stock and waste.
Where loss tends to arise
| Stage | Main causes of loss | Direction of countermeasures |
|---|---|---|
| Catch and landing | Delayed cooling, damage to the fish | Immediate cooling on board, careful handling |
| Market and transport | Temperature rises, breaks in temperature control during transfers | Temperature records, strict low-temperature transport |
| Processing and wholesale | Discarded non-standard goods, supply-demand mismatch | Use of non-standard goods, visibility of reservations and orders |
| Retail and food service | Unsold stock, expired dates, leftovers | Demand forecasting, markdowns, smaller portions |
| Households | Overbuying, deterioration in the refrigerator | Better buying and storage methods |
Hygiene management: mandatory HACCP
On the food hygiene side, the Food Sanitation Act was revised in June 2018, and in principle all food business operators are now required to carry out hygiene management in line with HACCP. Seafood wholesalers are covered regardless of the number of employees or facility size, and the Ministry of Health, Labour and Welfare publishes guidance manuals for seafood wholesalers and intermediate wholesalers. HACCP is a way of thinking that sets and records critical control points such as temperature; as a result, temperature control becomes more visible, which also helps cut waste from spoilage.
For supply-demand adjustment at sites that handle large volumes of seafood such as conveyor-belt sushi, Food Loss Measures at Conveyor-belt Sushi is a useful reference.
Spreading Technology and Policy | Sensors, Demand Forecasting and Freshness-preservation Trials
Digital technology that makes temperature visible
In recent years, sensors that record the temperature inside a vehicle during transport and traceability systems that can follow a catch from landing to the store have spread. When temperature records remain, it becomes possible to identify at which stage freshness dropped, which clarifies responsibility and what to improve. Digitalization of fisheries in general is covered in Smart Fisheries, and history management in Seafood Traceability.
National support for developing freshness-preservation technology
The Fisheries Agency includes "support for demonstrating supply-expansion and innovative freshness-preservation technology" among the subsidy targets of the FY2025 supplementary budget's "Seafood Export Acceleration Collaboration Promotion Project". Freshness-preservation technology is positioned not only as a way to widen sales channels through exports but also as a means of reducing waste at home. Details and application conditions change every fiscal year, so check the Fisheries Agency's published materials for the latest information.
Not leaving surplus through demand forecasting and made-to-order production
Alongside technology that cools and keeps, what matters is a mechanism that avoids surplus in the first place. In retail and food service, efforts are advancing to forecast demand from past sales and weather and adjust order quantities. Because seafood varies greatly with season and catch volume, the effect grows when combined with systems that decide the buyer first, such as pre-orders and direct shipment from the producing area.
Combining technology and systems
- Cooling and freezing: slow down spoilage
- Temperature records and history management: find where spoilage happened
- Demand forecasting and pre-sales: ship only the amount that will be used
Climate Change and Energy-saving Challenges | The Cost of Cooling
Warming water changes what is caught
Rising sea temperatures are changing the species and volumes of fish caught, as seen in the poor catches of Pacific saury and Japanese flying squid. As catches become unstable, it matters even more not to waste a single precious fish, while cooling and handling methods also need to be adapted to new species. The background is explained in Fish Disappearing as Seas Warm.
The dilemma of cooling energy and refrigerants
As noted above, the food cold chain accounts for about 4% of global greenhouse gas emissions. A December 2025 document from UNEP and others points out that fossil-fuel-based refrigeration on fishing boats may increase emissions unless combined with energy-saving technology and refrigerants with low global warming potential (GWP). Making cooling more efficient is essential so that measures against loss do not create another environmental burden.
A 2024 study also showed that optimizing refrigeration in sub-Saharan Africa could cut food loss by 47% and emissions by 66%. The authors caution, however, that the estimate excludes emissions from the refrigeration equipment itself and that the real effect depends on technology efficiency and the carbon intensity of electricity.
Pitfalls in thinking
- Do not stop at "cooling solves it"; evaluate the energy and refrigerants used as well
- There are also demonstrations that combine renewable energy, such as solar-powered ice makers
What We Can Do | Buying, Storing and Eating
When choosing and carrying home
- Choose fish displayed on ice, with firm flesh and clear eyes
- After buying, use an ice pack or cooler bag and go straight home without letting the temperature rise
- Choosing seasonal fish, locally caught fish and unused fish reduces forced transport and waste
Storage tips at home
If you will not eat it right away, wipe off moisture, wrap it in plastic to cut off air and put it in the coldest part of the refrigerator. Portions that cannot be eaten the same day should be divided and frozen early. The guideline for the freezer is −18°C or below; opening the door often raises the temperature, so pay attention to where you place items. Do not refreeze what has thawed, and eat it soon. For the reality of household food loss, see Household Food Loss of 2.36 Million Tonnes a Year.
Ways to eat it all
Cooking that uses every part, including the bones and skin, not only reduces waste but also draws on a treasury of umami. Industrial-scale uses are also covered in Turning Fish Processing Residue into Resources.
Three things you can do from today
- Do not let bought fish warm up; refrigerate or freeze it quickly
- Divide what you cannot finish and freeze it early
- Use the bones and trimmings to make stock
Summary | Protect Freshness with Science and Connection
A fish's freshness is determined by the scientific mechanism of ATP breakdown after death, and its pace changes with temperature, species and handling. Capture the state with indicators such as the K value, slow spoilage with ice storage, seawater ice and rapid freezing, and make management visible with HACCP and temperature records. An unbroken chain of low temperature is the foundation for reducing the loss, which is said to reach up to about 35% worldwide.
At the same time, efforts to reduce the energy and refrigerant burden of cooling, mechanisms that avoid surplus, and better buying and storage at home are all indispensable. Eating fish to the last bite and enjoying it directly connects to valuing the ocean's resources.
Summary of this article
- The FAO estimates that up to about 35% of global fisheries and aquaculture output is lost
- Freshness is determined by ATP breakdown, and a K value of 20% or less is the guideline for raw eating
- Temperature control, such as ice storage, seawater ice and rapid freezing, is the most effective
- Combine optimization of supply and demand with household efforts while giving thought to the energy load of cooling
References and Sources
- FAO: Food Loss and Waste in Fish Value Chains – Estimates of fisheries and aquaculture loss and waste, and countermeasures
- UNEP: Sustainable food cold chains – Opportunities and challenges of food cold chains (FAO and UNEP, 2022)
- Ministry of Agriculture, Forestry and Fisheries (Japan): Estimate of food loss – Food loss in fiscal 2024 (announced June 2026)
- Ministry of the Environment (Japan): Food loss portal – The current state of food loss and reduction efforts
- Fisheries Agency (Japan): White Paper on Fisheries – Consumption and self-sufficiency of edible fish and shellfish
- Shimane Prefecture: Fish freshness and the K value (Tobiuo Information) – Explanation giving a K value of 20% or less as the guideline for raw eating
- Kyoto Prefecture Marine Center: Report on the K value and freshness – Rise of the K value by species and comparison of killing methods
- Hokkaido Research Organization: Freshness preservation with seawater ice – Seawater ice storage test on flathead flounder
- Chiba Prefecture Fisheries Research Center: Changes in ATP-related compounds – Change in the inosinic acid ratio after catch
- Ministry of Health, Labour and Welfare (Japan): Hygiene management based on HACCP – Guidance manuals for seafood wholesalers and intermediate wholesalers, etc.
* Listed in order of reliability: government and academic institutions > peer-reviewed papers > specialist organizations > reliable media