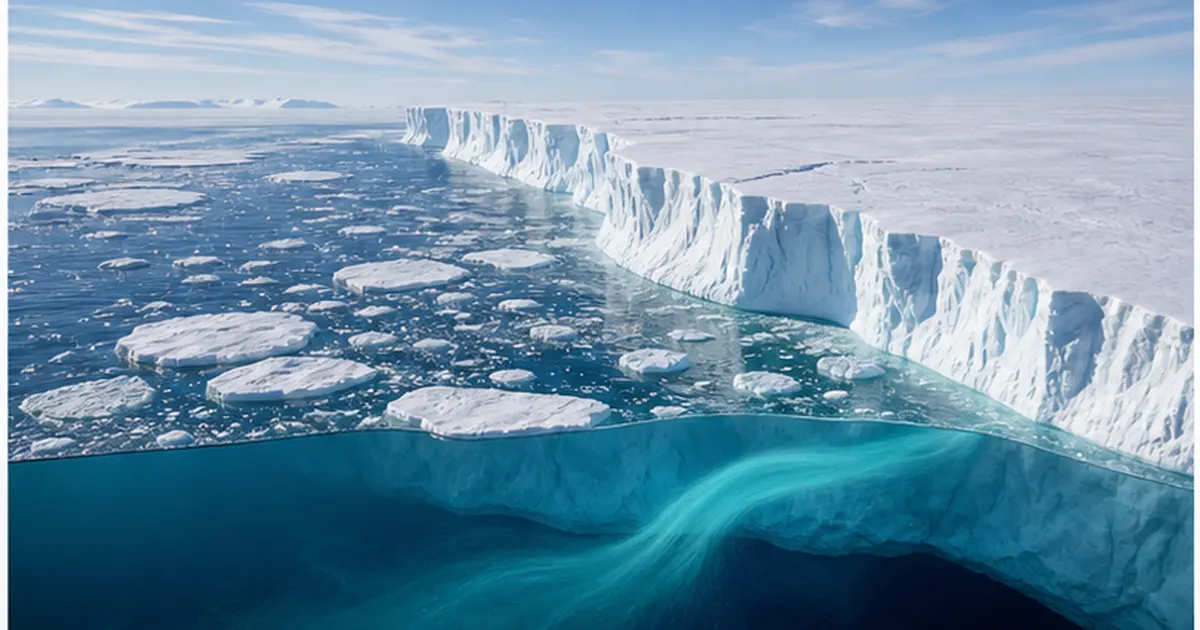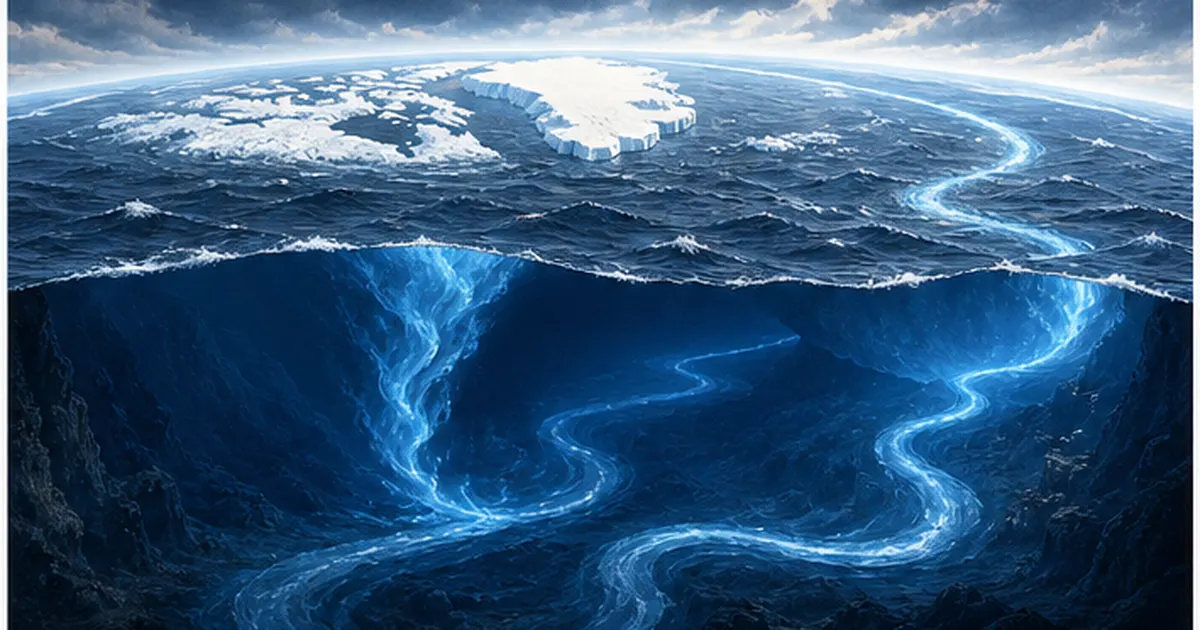
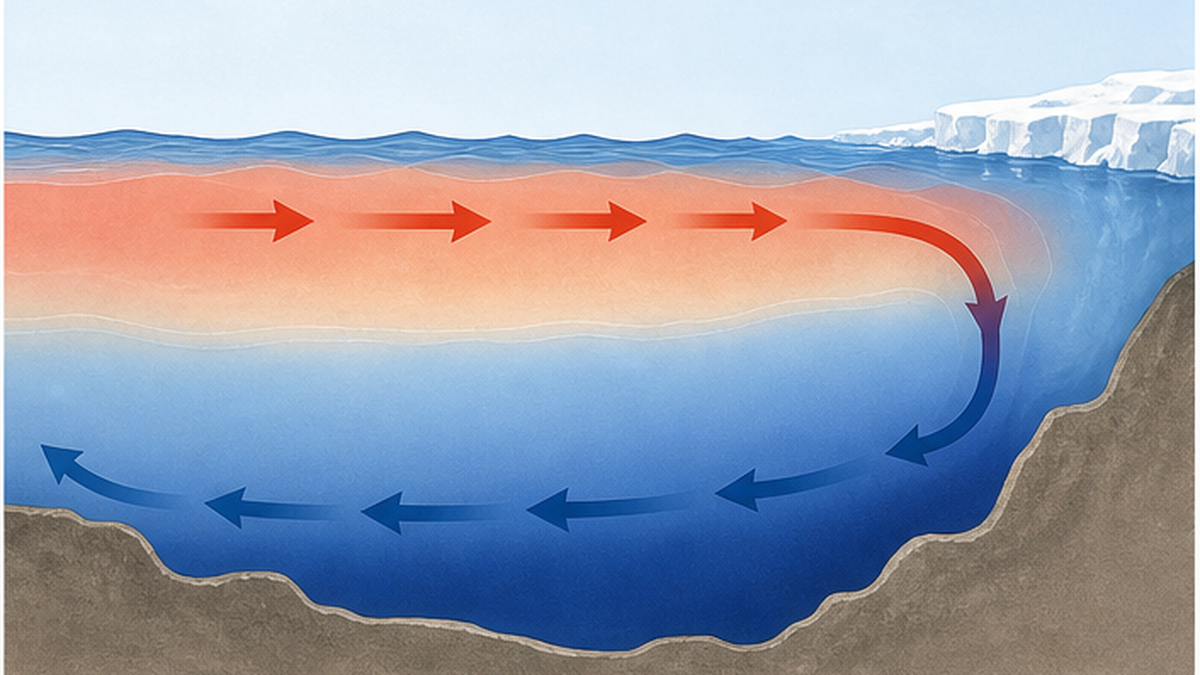
The ocean is far larger, and moves far more slowly, than most of us imagine. Seawater chilled at the surface of the North Atlantic grows dense, sinks below 2,000 meters, travels across the world's seafloor, and returns to the surface only after about 1,000 years. This enormous flow is the thermohaline circulation - popularly known as the ocean's great conveyor belt.
Its Atlantic branch, the AMOC (Atlantic Meridional Overturning Circulation), is weakening. Over the past few years this has become one of the most closely watched questions in climate science. In 2023 a paper suggesting collapse could come as early as mid-century made headlines worldwide, while the IPCC assesses that an abrupt collapse before 2100 is unlikely. Why do experts differ so sharply about the same phenomenon?
This article works through the basics of the thermohaline circulation, the pace of weakening shown by 20 years of direct observation, the one patch of the North Atlantic that is cooling, the debate over the tipping point, and the truth behind the abrupt-cooling scenario dramatized in film - checking primary sources along the way. Without stoking alarm, and without playing it down, the aim is to draw a clear line between what we know and what we do not.
この記事で学べること
- How the thermohaline circulation is driven purely by differences in temperature and salinity, and its roughly 1,000-year timescale
- How the Atlantic branch, the AMOC, is measured by the observing array at 26.5°N, and how much it has weakened
- The causes of weakening - warming, Greenland ice sheet melt and freshening - and the positive feedback that can make it run away
- Why studies claiming the tipping point is near and the IPCC's cautious assessment disagree, and how to read both correctly
- Which parts of the film The Day After Tomorrow are exaggeration, and which parts are scientifically sound
- What a collapse would mean (cooling in Europe, sea level rise, shifting monsoons) and how the effects would reach Japan
What Is the Thermohaline Circulation? The Ocean's Great Conveyor Belt
When people think of ocean currents, most picture surface flows pushed along by the wind, like the Kuroshio or the Gulf Stream. But the ocean holds another kind of flow, driven by an entirely different principle: a deep, slow, planetary-scale movement powered by nothing but differences in the "weight" of water. That is the thermohaline circulation.
Only two things set the weight of water: temperature and salinity
The density of seawater is set essentially by temperature and salinity. Colder is heavier; saltier is heavier. Conversely, water that is warm and low in salt (diluted by fresh water) becomes lighter and floats at the surface. The name says it plainly: "thermo" refers to heat and "haline" to salt - the two forces that drive the whole circulation.
The striking part is how small these density differences are. Surface and deep water differ by less than 0.1% in density, yet spread across the planet that tiny contrast generates a flow far larger than all the world's rivers combined. A slow but ceaseless convection is always underway inside the ocean.
There are only about two places on Earth where water sinks
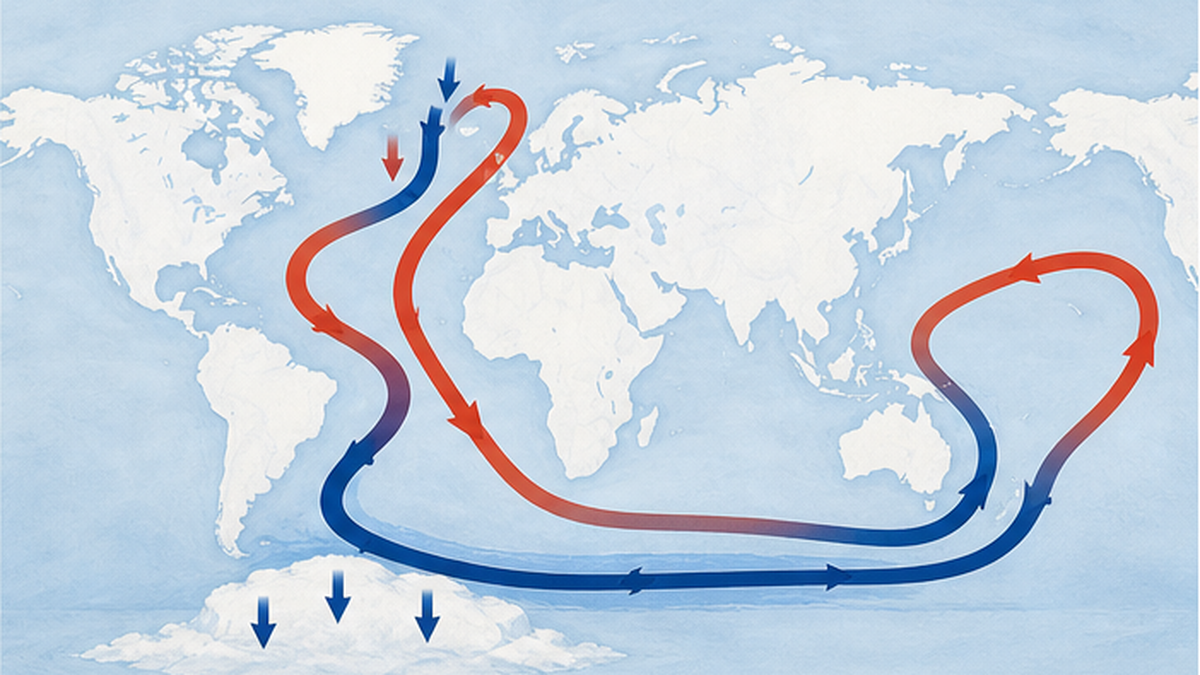
The "deep water formation regions" where surface water sinks all the way to the abyss exist in only a few places on Earth. According to the Japan Meteorological Agency, the main sites are the North Atlantic off Greenland and the waters around Antarctica. Both are extremely cold, and when sea ice forms it expels salt and raises the salinity of the surrounding water - together making seawater heavy enough to sink.
- North Atlantic Deep Water (NADW): sinks around Greenland and the Labrador Sea, then flows south through the Atlantic
- Antarctic Bottom Water (AABW): sinks along the Antarctic coast, including the Weddell Sea, and spreads across the deepest parts of the world ocean
- Upwelling regions: across broad areas of the Pacific and Indian Oceans and the Southern Ocean, deep water slowly returns to the surface
Crucially, the North Pacific has no deep water formation region. Its surface waters are too low in salinity, so no matter how cold they get they never become heavy enough to sink. Pacific deep water therefore consists of water that has travelled all the way from the Antarctic and the Atlantic. This asymmetry underpins the discussion of impacts on Japan later in the article.
A round trip of roughly 1,000 years
Water that sinks is estimated to take about 1,000 years to travel the world's seafloor and return to the surface. On that timescale, the water now sitting in the deep Pacific may have been chilled and sunk at the surface of the North Atlantic in medieval times. This slowness carries two implications. First, the ocean keeps a memory of climate change lasting centuries. Second, once the circulation changes, it will not return to its former state within our lifetimes.
| Surface circulation | Deep circulation (thermohaline) | |
|---|---|---|
| Main driver | Wind (westerlies and trade winds) | Density differences from temperature and salinity |
| Depth | Generally down to a few hundred meters | Below 1,000-4,000 meters |
| Speed | Up to around 1 meter per second in places | Only a few centimeters per second |
| Time for one loop | Years to decades | About 1,000 years |
| Examples | Kuroshio, Gulf Stream | North Atlantic Deep Water, Antarctic Bottom Water |
Key points so far
- The thermohaline circulation is a planetary-scale deep flow driven only by temperature and salinity differences
- Sinking is essentially limited to the North Atlantic and the waters around Antarctica
- One loop takes about 1,000 years. Once it changes, reversing it is far from easy
Why the Atlantic Circulation, the AMOC, Gets Special Attention
Within the whole thermohaline system, researchers and the media focus on the Atlantic portion. It is called the AMOC (Atlantic Meridional Overturning Circulation), sometimes rendered in Japanese as the Atlantic north-south thermohaline circulation.
What exactly does AMOC refer to?
The AMOC refers to the entire overturning of water seen in the north-south (meridional) plane of the Atlantic. Warm, salty surface water is carried north from the tropics, cools and sinks in the North Atlantic, then flows back south at depth. That full loop is the AMOC.
A common misconception is that the AMOC is pure thermohaline circulation. In fact, the strong westerlies over the Southern Ocean draw water upward, and mixing also helps sustain the loop. Equating "thermohaline circulation" with "AMOC" can therefore lead to misreading the debate. When the news says "the great ocean circulation is stopping," it almost always means AMOC weakening.
Carrying heat north on the scale of a petawatt
Near 26°N, the AMOC is estimated to carry heat on the order of one petawatt (10 to the 15th power watts). Given that humanity's total primary energy consumption is a little under 20 terawatts, this means tens of times that amount of heat is quietly being carried north through the ocean at all times.
That heat is ultimately released from the North Atlantic surface into the atmosphere and carried to Europe by the westerlies. So if the strength of the AMOC changes, the very foundation of the climate around the North Atlantic changes with it. This is why the AMOC is counted among the climate system's "tipping elements."
"The Gulf Stream keeps Europe warm" is only half right
London sits at 51.5°N - about 670 kilometers further north than the northern tip of Hokkaido (Cape Soya, at 45.5°N), roughly level with the upper half of Sakhalin. Yet its average January temperature is around 5°C, not far off winter in Tokyo. Attributing this warmth to the Gulf Stream is a familiar explanation, but climatologists point out that it is an oversimplification.
In reality several factors combine: (1) the westerlies cross the ocean before reaching the continent, (2) the sea stores heat better than land and stays relatively warm in winter, and (3) atmospheric waves generated by the Rocky Mountains act to cool the eastern seaboard of North America while warming Europe. Ocean heat transport is one important factor among these, not the sole cause.
That said, model experiments agree that a large weakening of the AMOC would push European winters toward the cold. "Only the Gulf Stream keeps Europe warm" is an exaggeration - but "it would not matter if the Gulf Stream stopped" is simply wrong.
Glossary: the sverdrup (Sv)
The unit of ocean volume transport. 1 Sv equals one million cubic meters per second. All the world's rivers combined amount to only about 1.2 Sv, whereas the AMOC has been observed at roughly 17 Sv on average. The ocean operates on a completely different order of magnitude from flows on land.
Is It Really Weakening? Twenty Years of Direct Observation and a Cooling Sea
The claim that the AMOC is weakening rests on several very different kinds of evidence. Each has strengths and limits, so it is worth taking them one at a time.
Twenty years of data from the RAPID array
The single most important direct measurement of the AMOC comes from the RAPID-MOCHA-WBTS array deployed along 26.5°N. Since April 2004 a line of moorings has spanned the Atlantic, continuously measuring temperature, salinity, pressure and velocity to compute the strength of the circulation. It is the longest directly observed time series in the world.
From these measurements, the mean for April 2004 to October 2012 was estimated at 17.2 Sv. Over 2004-2023, a weakening of 1.0 Sv per decade (range 0.4-1.6 Sv) has been reported. The detail, however, is not a smooth decline: the AMOC weakened from 2004 to around 2012, strengthened again until roughly 2018, then weakened once more. Ten-day averaged values have ranged as widely as -4.3 to 32.3 Sv.
Much of that swing comes from wind variability, and observational scientists broadly agree that 20 years is still too short to pin down a long-term trend. "Observations confirm a weakening" and "observations prove a long-term, warming-driven decline" are two entirely different statements.
View the observational dataRAPID AMOC Observing ProjectThe international array that has continuously monitored the AMOC at 26.5°N since 2004. Data and the latest time series are published openly.🔗 rapid.ac.ukThe fingerprint left in sea surface temperature: the North Atlantic cold blob
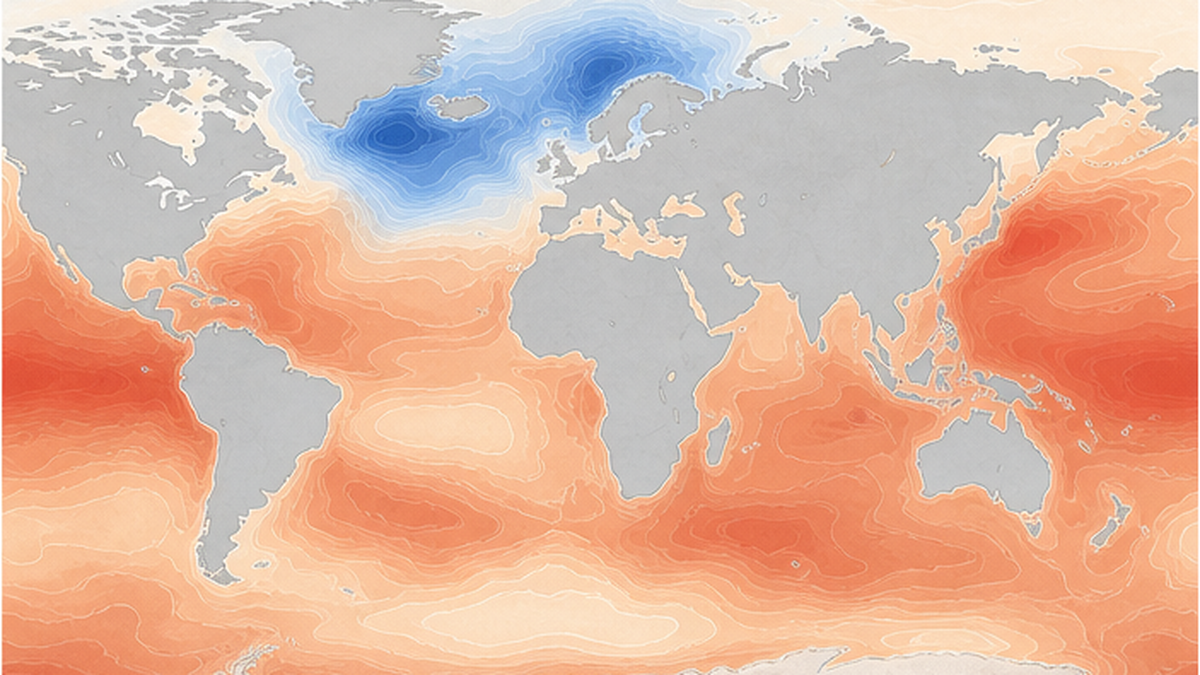
With only 20 years of direct measurement, earlier changes must be inferred indirectly - and the tool for that is the pattern of sea surface temperature. While the planet as a whole warms, one corner of the subpolar North Atlantic south of Greenland is instead cooling. This region is known as the cold blob, or the "warming hole."
That cold patch sits exactly where the AMOC delivers its heat, which is why it has been read as a fingerprint of a weakening circulation no longer bringing that heat north. But the region can also cool because of clouds and winds, so attributing the cause has long been contested.
A study by Stefan Rahmstorf and colleagues at the Potsdam Institute for Climate Impact Research, published in Geophysical Research Letters in May 2026, reanalyzed the heat budget of this region and concluded that the cooling is caused not by heat escaping to the atmosphere but by a decline in the heat the ocean brings in. The drop in heat content down to 1,000 meters has been especially pronounced since 1993. It is an important piece of evidence supporting the AMOC weakening hypothesis.
The weakest in 1,000 years? Estimates from paleoclimate records
To look further back, researchers turn to proxies: the grain size of seafloor sediments (faster flows leave coarser particles), the chemistry of coral and clam shells, and Greenland ice cores. Several studies combining these lines of evidence suggest the AMOC may now be at its weakest level in at least the past 1,000 years.
Proxies, however, do not measure circulation strength directly, and converting them involves assumptions. "The weakest in a millennium" is best received not as an established fact but as a strong inference pointed to by multiple indirect lines of evidence.
| Type of evidence | What it shows | Strengths | Limits |
|---|---|---|---|
| RAPID direct observations (2004-) | Actual transport (Sv) | The only direct measurement; high precision | Only 20 years long, with large wind-driven short-term variability |
| Sea surface temperature fingerprint | Relative changes in circulation strength | Reaches back more than a century | Temperature also changes for reasons unrelated to circulation |
| Paleoclimate proxies (sediments, corals, etc.) | Variability over centuries to millennia | Provides long-term context | Conversion requires assumptions and carries large errors |
| Climate models (CMIP and others) | Future projections and physical causality | Allows mechanisms to be tested | Criticized for insufficient resolution to reproduce the past |
Why Is It Weakening? Warming, Ice Melt and Freshening
The logic behind AMOC weakening is actually simple. Sinking happens because seawater becomes heavy enough, so anything that makes seawater lighter slows the sinking. Warming does both at once: it raises temperature and lowers salinity.
Light water simply does not sink
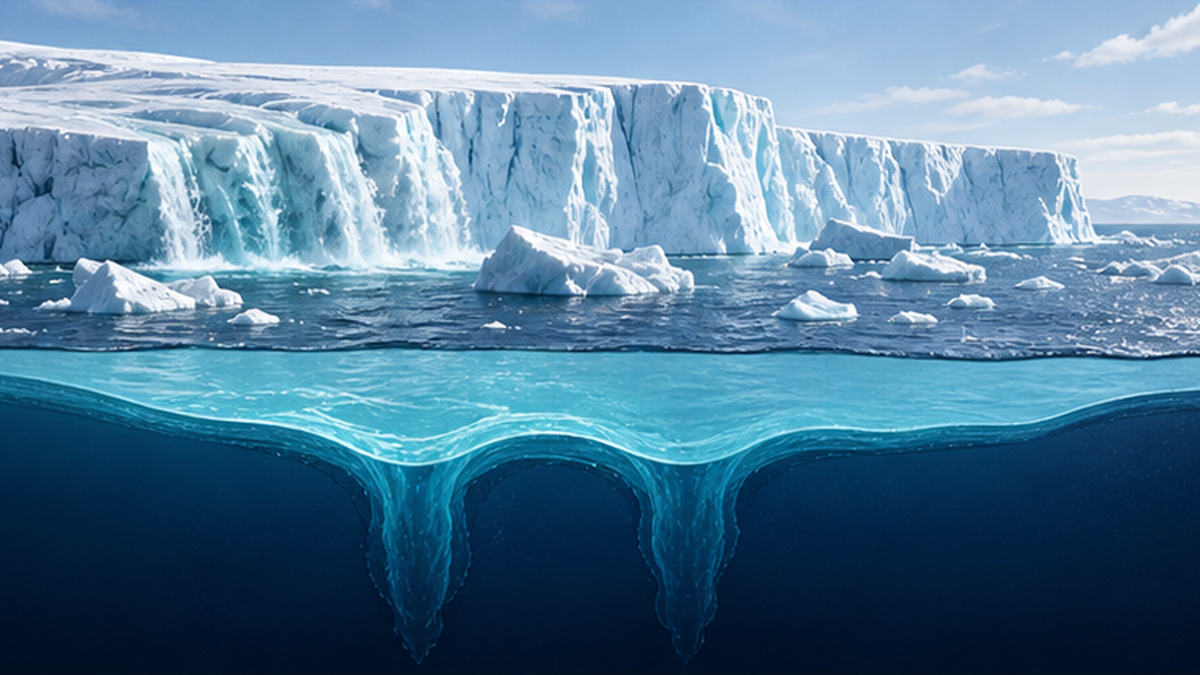
The first pathway is temperature. As the North Atlantic surface warms, winter cooling no longer makes it as dense as before, so it sinks to shallower depths. The second is salinity. Added fresh water lowers salinity, which also lowers density. Together they make winter convection - the process by which surface water mixes all the way down - far less likely to occur.
A 2025 study using a high-resolution model showed that the AMOC tipping point is linked to the collapse of winter convection in the North Atlantic. Once deep winter mixing stops, vertical mixing weakens, which in turn weakens the circulation further in a chain reaction.
The Greenland ice sheet as a freshwater tap
The largest source of fresh water is the Greenland ice sheet. According to data from the IMBIE project, which tracks ice sheet mass balance, Greenland lost an average of about 107 gigatonnes per year from 1972 to 2025, and roughly 264 gigatonnes per year over the more recent 2002-2025 period. Cumulative loss from the end of 1972 to the end of 2025 reached 5,747 ± 467 gigatonnes, equivalent to raising global mean sea level by 16.0 ± 1.3 millimeters.
Year-to-year variation is large, though. The calendar-year 2024 loss was 55 ± 35 gigatonnes, the smallest since 2013, while the hydrological year from September 2024 to August 2025 saw 139 gigatonnes. It is worth being precise that the loss is not simply accelerating every single year. What matters is that the long-term average is firmly negative, and that this water pours straight into the sinking regions.
Nor is the ice sheet the only source. A warmer atmosphere carries more water vapor, increasing high-latitude precipitation, and sea ice melt adds more still. Looking only at the ice sheet underestimates the total fresh water entering the ocean.
The salt advection feedback: weaker means weaker still
The reason the AMOC is said to have a possible tipping point is this positive feedback. The AMOC carries salty water north from lower latitudes. When the circulation weakens, that salt transport also declines. The North Atlantic then becomes even lighter, and the sinking weakens further - a self-amplifying loop.
- Warming and meltwater make the North Atlantic surface lighter
- Sinking weakens and AMOC transport declines
- Less salt is carried in from lower latitudes
- The North Atlantic becomes even fresher and less dense
- Back to step 1, with the change accelerating itself
If this loop becomes strong enough, the system can shift abruptly to a different stable state even under gradual external forcing - what is known as tipping. Conversely, how strong the feedback is determines how near the tipping point appears to be. That is exactly what sits at the center of the disagreements among researchers discussed below.
Points that are easily missed
- AMOC weakening is not about "what happens when all the ice melts" - what matters is the rate at which fresh water pours in
- Fresh water comes not only from the ice sheet but also from increased precipitation and sea ice melt, which cannot be ignored
- Because of positive feedback, the change will not necessarily unfold smoothly
Is the Tipping Point Near? Why Researchers Disagree
This is the heart of the matter, and the most confusing part. About the same phenomenon, there are papers saying collapse could come by mid-century and assessments saying collapse before 2100 is unlikely. Both are serious science, and neither is misinformation. They simply start from different methods.
1. 2023: early warning signals point to 2025-2095
A paper by the Ditlevsen siblings of the University of Copenhagen, published in Nature Communications in 2023, drew enormous attention. Using North Atlantic sea surface temperature as a proxy, they analyzed the statistical signs that appear as a system nears a tipping point - rising variance (loss of resilience) and rising autocorrelation (critical slowing down) - and estimated the timing of AMOC collapse at 2025-2095, with a central estimate near mid-century.
The strength of this approach is that it speaks from observational data alone, without depending on model uncertainty. Its weaknesses were also pointed out: the assumption that sea surface temperature faithfully proxies AMOC strength, and the validity of fitting a simple mathematical model. Criticism was substantial, but the paper played a major role in raising the possibility that the tipping point may not be a distant-future concern.
2. 2024: a physics-based early warning indicator
In 2024, van Westen and colleagues at Utrecht University published a study in Science Advances using an indicator based not on statistical signs but on a physical quantity: whether the circulation exports or imports fresh water at the southern edge of the Atlantic (34°S). In their model experiments this indicator issued a warning roughly 25 years before collapse, and they concluded that the real AMOC is on a trajectory toward tipping.
The study also depicted what a collapse would look like. Once tipped, the AMOC would effectively shut down within about 100 years and would not recover naturally thereafter.
3. The IPCC assessment: weakening is near certain, abrupt collapse "probably not"
Chapter 9 of the IPCC Sixth Assessment Report (AR6) is more cautious, and makes two points. First, it is "very likely" that the AMOC will weaken over the 21st century under every emissions scenario - a high-confidence assessment grounded in physical understanding.
Second, the judgment that this decline will not involve an abrupt collapse before 2100 carries only "medium confidence". In other words, the IPCC is saying that an abrupt collapse probably will not happen, but the evidence is not strong enough to say so definitively. Behind that caution lies low confidence in reproducing 20th-century AMOC changes, and low confidence in quantitative projections as well.
Reading this as "the IPCC said everything is fine" is a mistake. What the IPCC says is that the AMOC will certainly weaken, and that whether it collapses cannot yet be judged.
4. 2025-2026: the debate is intensifying, not settling
Research has only accelerated since. A study released by the University of Washington in May 2025 reported that once the effect of Southern Ocean winds is taken into account the weakening is limited, with a decline of only 18-43% by the end of the 21st century. Meanwhile, a study in Environmental Research Letters the same year extended models beyond the usual 2100 cutoff and found that shutdown occurred after 2100 in 67% of runs under high emissions, 30% under medium emissions and 25% under low emissions. The picture is one of holding on through this century, with the following century unknown.
In October 2025 a high-resolution fingerprint analysis produced further support for AMOC weakening, and new studies have continued into 2026. The science is diverging rather than converging - that is the honest state of play as of 2026.
| Study or assessment | Method | Summary of conclusion |
|---|---|---|
| Ditlevsen & Ditlevsen (2023) | Statistical early warning signals in sea surface temperature | Collapse possible between 2025 and 2095 (central estimate mid-century) |
| van Westen et al. (2024) | Physical indicator based on freshwater transport | On a trajectory toward tipping; shutdown within about 100 years once tipped |
| IPCC AR6 WG1 Chapter 9 (2021) | Synthesis of many climate models | Weakening this century is very likely; abrupt collapse ruled out with only medium confidence |
| University of Washington and others (2025) | Model analysis accounting for Southern Ocean winds | Weakening is limited, at 18-43% by the end of the century |
| Environmental Research Letters (2025) | Model experiments extended beyond 2100 | Shutdown after 2100 in 67% of high-emissions runs and 25% even under low emissions |

Three reasons the conclusions diverge
- The observations are short: with only 20 years of direct measurement, natural variability cannot be cleanly separated from a long-term trend
- Models may be biased toward stability: many climate models have been criticized for representing the AMOC as more stable than it is, because of resolution limits
- "Collapse" is not defined consistently: whether it means a complete shutdown or a large weakening changes the probability figures entirely
How Much of The Day After Tomorrow Is True?
One film comes up in every discussion of the thermohaline circulation: The Day After Tomorrow, directed by Roland Emmerich and released in 2004. It is no exaggeration to say this film shaped the public image of the AMOC.
The scenario the film depicts
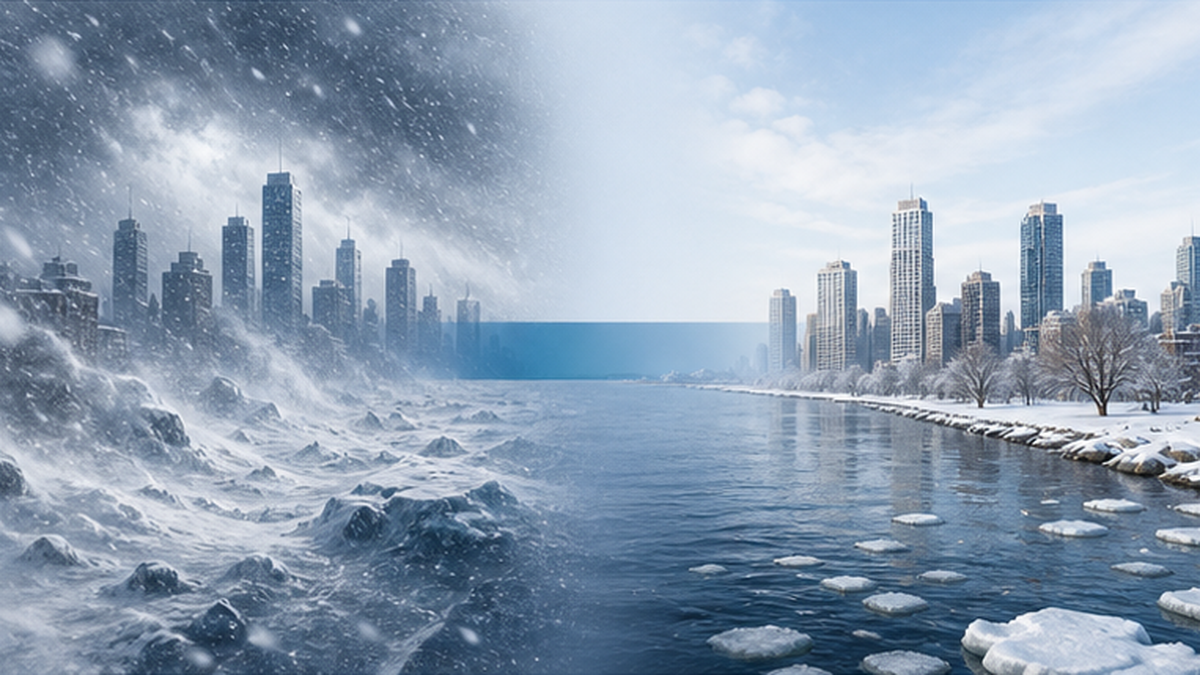
In the film, melting polar ice pours vast quantities of fresh water into the North Atlantic and the thermohaline circulation stops. Within a matter of days, gigantic superstorms form, frigid air descends from the upper atmosphere and flash-freezes the Northern Hemisphere. New York is hit by a storm surge and then locked in ice, and humanity flees south.
An ice age in days is physically impossible
To be blunt, that timescale is pure fiction. The ocean has a heat capacity orders of magnitude greater than the atmosphere - the top three meters of the sea alone can store as much heat as the entire atmosphere. Because of that enormous reservoir, it takes decades to centuries for the climate to respond after the circulation weakens. Continents freezing in days, or air at minus 100°C descending to flash-freeze the surface, is impossible under atmospheric physics.
The scientist who advised the production said at the time of release that the timescale was exaggerated for dramatic effect. Enjoying the film and understanding the risk correctly are two things worth keeping separate.
So what part is scientifically sound?
Strip away the exaggeration and something real remains. The causal direction - fresh water inflow weakens the thermohaline circulation, and the region around the North Atlantic cools - is a storyline climate science supports. What differs is the speed and the scale: decades rather than days, and regional cooling around the North Atlantic rather than a global ice age.
The Younger Dryas as a real precedent
What lends that storyline credibility is the Younger Dryas, roughly 12,900 to 11,700 years ago. In the middle of the warming that followed the last glacial period, the high latitudes of the Northern Hemisphere abruptly swung back into cold conditions, and Greenland ice cores record temperature changes on the order of 10°C within just a few decades.
The leading hypothesis is that water from a vast glacial lake (Lake Agassiz), formed as the ice sheet covering North America melted, surged into the North Atlantic and weakened the thermohaline circulation. Recent work has raised objections about the drainage route and the trigger, so it is more accurate to treat this as a leading hypothesis rather than a proven fact. Even so, it remains a real example showing that Earth's climate can swing sharply within decades.
The distance between the film and the science
- Wrong: the Northern Hemisphere freezes in days - impossible given the ocean's heat capacity
- Wrong: the whole planet enters an ice age - global warming continues, and the cooling is regional
- Right: freshwater inflow weakens the circulation - a sound mechanism
- Right: the North Atlantic region cools by several degrees over decades - there is a historical precedent, and models show it
What Would Happen If It Collapsed? Cooling, Sea Level Rise and Monsoons
Separate from arguments about probability, it is worth knowing what would happen if it did occur. A risk with severe consequences should not be dismissed on low probability alone.
European winters would become something else entirely
The most direct impact would be cooling around the North Atlantic. A 2025 study calculated that if the AMOC collapsed, a once-in-a-decade cold snap in London could approach minus 20°C, while Oslo could see extremes around minus 48°C. Winter storms would increase and day-to-day temperature swings would grow larger.
There is an important caveat. In a world roughly 4°C warmer than pre-industrial levels, warming itself would cancel out the cooling from an AMOC collapse in some regions. In other words, the idea that "an AMOC collapse would cool things down and offset global warming" is wrong. What would actually happen is a hot planet with a few regions turning violently cold and unstable - the worst possible combination for agriculture.
Sea level piling up along Atlantic coasts
An easily overlooked effect is sea level rise. As the AMOC weakens, water that would otherwise be carried north accumulates along the coast, raising sea level regionally. Studies estimate up to about 50 centimeters of additional rise along European coastlines. Along the northeastern United States, increased flooding has already been linked to AMOC weakening.
This comes on top of global sea level rise from thermal expansion and ice sheet melt. For how sea level rise works in general, see Will Sea Level Rise Erase 90% of Japan's Beaches? Ports, Groundwater, Storm Surge Risk and Coastal Defense.
The intertropical convergence zone and monsoons shifting south
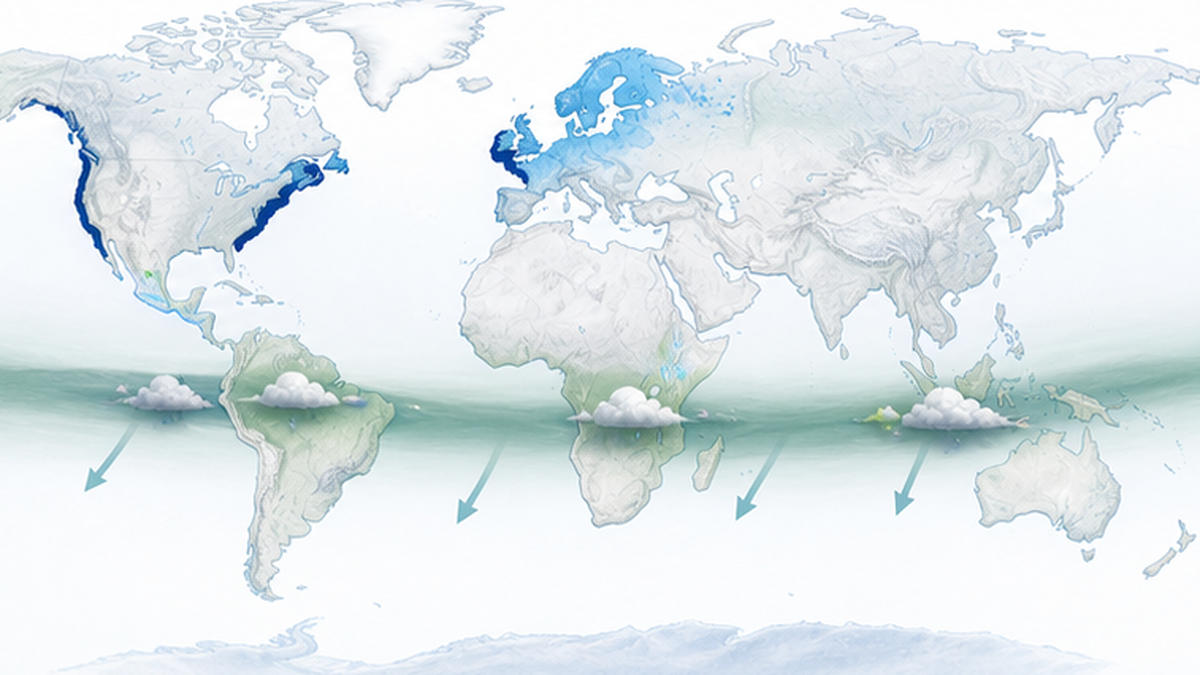
Because the AMOC carries heat into the Northern Hemisphere, stopping it would upset the north-south heat balance. As a result, the intertropical convergence zone (ITCZ), which brings rain near the equator, is projected to shift south. That means changes in the amount and timing of the rainy season across monsoon regions of West Africa, South Asia and South America, directly affecting food production for billions of people. Some researchers argue the humanitarian impact here would exceed that of Europe's cold.
Impacts on marine ecosystems and fisheries
Deep circulation also lifts nutrients stored in the deep sea toward the surface and carries surface oxygen down into the depths. If it weakens, nutrient supply could fall and primary production with it, while oxygen delivery to the deep sea thins out. The North Atlantic is one of the world's great fishing grounds, and shifts in the distribution of stocks such as cod and herring would strike directly at coastal livelihoods. Thinner oxygen supply to depth could also expand low-oxygen waters.
The fate of the carbon dioxide the ocean has absorbed would change as well. If the physical pump - by which sinking cold water carries carbon into the deep - weakens, the ocean's capacity to absorb carbon declines. That subject is covered in detail in The Saturation of the Ocean Carbon Sink.
| Area of impact | Projected change | Regions affected |
|---|---|---|
| Temperature | Extreme winter cold and greater temperature variability | Northern Europe, the UK, northwestern Europe |
| Sea level | Regional addition of up to around 50 cm | European coasts, the northeastern United States |
| Precipitation | Southward shift of the ITCZ and disruption of monsoons | West Africa, South Asia, South America |
| Marine ecosystems | Reduced nutrient supply and lower oxygen delivery | The entire North Atlantic |
| Carbon cycle | Reduced ocean capacity to absorb carbon dioxide | The whole planet |
Impacts on Japan and the Pacific: Not a Distant Ocean's Problem
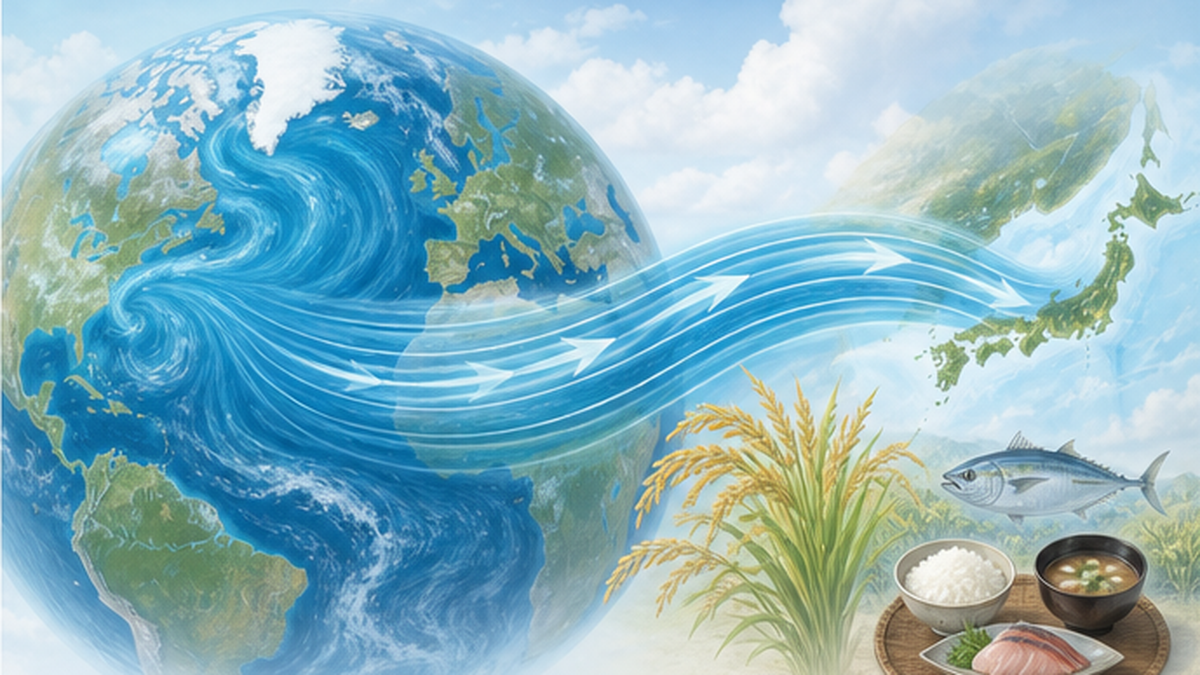
You might think this is an Atlantic story. But the thermohaline circulation is one continuous flow, and Japan is part of it. The way the effects arrive, however, looks quite different from the Atlantic coasts.
The premise: the Pacific has no sinking region
As noted in the first section, the North Pacific has no deep water formation region. According to the Japan Meteorological Agency, Pacific deep water consists of water that sank around Antarctica and then moved north, making the North Pacific something like the end of the line. So even if the AMOC weakens, Pacific deep circulation will not change abruptly in the same way.
Even so, the mechanism by which deep water slowly rises and carries nutrients works the same in the Pacific. If the global circulation changes, Pacific upwelling and nutrient supply will eventually be affected too - but on a timescale of centuries, not something we would feel within decades.
For Japan, the effects arrive as a chain reaction through the climate
What is realistic for Japan is a chain reaction through the atmosphere. Rapid cooling of the North Atlantic would alter Northern Hemisphere pressure patterns and the meandering of the westerlies, affecting how cold air enters over Japan and where the rainy season front sits. Disruption of the Asian monsoon is not unrelated to Japan's rainy season or typhoon tracks.
The other channel is food. If European agriculture and North Atlantic fisheries are hit, international prices for grain and seafood follow. For Japan, whose calorie-based food self-sufficiency is under 40%, that is not someone else's problem. Changes in ocean currents arrive first as price tags at the dinner table - that is probably the most tangible way to think about it.
Not to be confused with the Kuroshio large meander
In Japan, "unusual ocean currents" usually means the Kuroshio large meander, but that is an entirely separate phenomenon from the AMOC. The Kuroshio large meander is a meandering of the wind-driven surface circulation that comes and goes on a timescale of years. Its causes and timescales differ from thermohaline weakening, so keep them apart when reading the news. For how rising sea temperatures affect ocean currents in general, see Ocean Current Changes Driven by Rising Sea Temperatures: Global Climate Impacts.
Living with Uncertainty: What We Can Do
Handled badly, the AMOC story tips in one of two directions: resignation that it is already too late, or indifference on the grounds that even experts do not know. Neither reflects what we actually know.
The biggest lever is still emissions reduction
There is no technology to reinforce the AMOC directly. We cannot scatter salt across the ocean or turn off the meltwater. Since the trigger for weakening is a warmer sea surface and Greenland's meltwater, the only measure that works is cutting greenhouse gas emissions.
That simplicity is, in a way, hopeful. In the 2025 study mentioned above, the probability of shutdown after 2100 was 67% under high emissions, 30% under medium and 25% under low - a clear difference driven by emissions. Even if we cannot say exactly where the tipping point lies, we do know we can slow the approach to it.
The value of not stopping the observations
It is easily overlooked, but maintaining long-term observing arrays like RAPID is decisive for this question. If 20 years of data cannot pin down a long-term trend, the answer is to keep observing, not to stop. As the record grows to 30 and 40 years, much of today's debate will settle on its own. Ocean observation depends on international funding, which makes its continuation a policy decision.
Changing how we read the news
Coverage of the AMOC swings wildly if you read only the headlines - "collapse by mid-century" and "collapse unlikely" can appear in the same week. Three things are worth checking. What was measured (direct observations, a proxy, or a model)? How is "collapse" defined (complete shutdown, or major weakening)? And how wide is the uncertainty (is a range given, not just a central value)? Checking just these three lets you gauge the strength of a claim with surprising accuracy.
What you can do today
- Do the basics of emissions reduction - switching to renewable electricity, insulating your home, rethinking how you travel (the only lever that works on the AMOC)
- When reading climate news, check three things: what was measured, how collapse is defined, and how wide the uncertainty is
- Support the maintenance of ocean observing networks; long-term observation is the shortest path to reducing uncertainty
- If something is framed in The Day After Tomorrow terms, question the timescale
Summary of this article
- The thermohaline circulation is a planetary flow driven by temperature and salinity differences, taking about 1,000 years for one loop
- Its Atlantic branch, the AMOC, has weakened by roughly 1.0 Sv per decade in direct observations since 2004 (though short-term variability is large)
- The causes are a warmer surface layer and freshening from sources such as Greenland ice sheet meltwater
- Studies arguing the tipping point is near sit alongside the IPCC's cautious assessment; differences in method produce differences in conclusion
- A freeze within days as in the film will not happen, but regional cooling over decades is scientifically possible
- A collapse would bring European cooling, coastal sea level rise and monsoon disruption at the same time
- The effects reach Japan through the westerlies and through food. The measure that works is emissions reduction, and the probabilities shift with emissions
参考文献・出典
- Japan Meteorological Agency, "Knowledge of Climate and the Ocean: Variability of the Deep Circulation" – Basics of the thermohaline circulation and its long-term variability (primary source, in Japanese)
- Japan Meteorological Agency, "Knowledge of the Ocean Interior: Deep Circulation in the Pacific" – Explains Pacific circulation, including the absence of deep water formation in the North Pacific
- IPCC Sixth Assessment Report WG1 Chapter 9 (Ocean, Cryosphere and Sea Level Change) – AMOC decline this century is very likely; the assessment that no abrupt collapse occurs before 2100 carries medium confidence
- RAPID AMOC Observing Project (UK National Oceanography Centre and partners) – Official site of the international array that has continuously observed the AMOC at 26.5°N since 2004
- Ditlevsen & Ditlevsen (2023), Nature Communications – Peer-reviewed paper estimating AMOC collapse at 2025-2095 from early warning signals (a widely debated study)
- van Westen et al. (2024), Science Advances – Peer-reviewed paper showing, via a physics-based early warning indicator, that the AMOC is on a tipping course
- NOAA Arctic Report Card 2025: Greenland Ice Sheet – Official reporting on the annual mass balance of the Greenland ice sheet
- Copernicus Climate Change Service, "Climate Indicators - Ice sheets" – Long-term ice sheet mass loss trends (averages and cumulative totals since 1972)
- JAMSTEC BASE, "What Is the Point of No Return for the Global Environment?" – A Japanese research institute's explanation of ocean observation and tipping point research
- Carbon Brief, "AMOC explainer" – A specialist outlet's overview of the research history and current debate around the AMOC
※ 信頼性の高い順に配列:政府機関・学術機関 > 査読済み論文 > 専門機関 > 信頼できるメディア