Antarctic ice is melting — we have heard this headline many times. But what gets lumped together as 'Antarctic ice' is really a collection of three very different kinds of ice: sea ice floating on the ocean, ice shelves where land ice pushes out over the sea, and the ice sheet piled kilometres deep on the continent itself. All three melt differently, affect sea level differently, and touch living things differently. Blur them together and the changes that matter disappear from view.
Antarctica holds roughly 90% of all the ice on Earth and is the planet's largest freshwater reservoir. If that ice all melted, global sea level is estimated to rise by more than 58 metres. That is not going to happen tomorrow. But since 2016 the sea ice ringing the continent has clearly begun behaving differently than before, and in February 2023 it reached the smallest extent in the satellite record. From the tiny algae living on the underside of the ice, to the emperor penguins raising chicks on top of it, to coastlines thousands of kilometres away in Japan, those changes are connected.
This article first sorts out the three kinds of Antarctic ice, then follows four questions in order: what actually happened when sea ice dropped; how the ecosystem beneath the ice is being unsettled; where the warm water melting shelves from below comes from; and why sea level projections have such a wide range. It draws on observational data and primary sources. Read it not as an alarm, but as an invitation to look at just how finely engineered this place is.
What you will learn
- The difference between sea ice, ice shelves and the ice sheet — and why each affects sea level in a completely different way
- How Antarctic sea ice dropped sharply after 2016, hit a satellite-era record low in 2023, and what its return to 'near average' in 2026 actually means
- How ice algae growing under the sea ice and Antarctic krill together hold up the Southern Ocean food web
- What the 'warm water' melting ice shelves from below really is, and how Japanese research teams traced the heat pathway to Totten Glacier
- Why Antarctica is the single largest source of uncertainty in global sea level projections, and how wide the 2100 outlook really is
- Realistic things that connect distant Antarctica with everyday life in Japan
Antarctica Has Three Kinds of Ice: Sea Ice, Ice Shelves and the Ice Sheet
The first step in reading Antarctic change correctly is to separate the ice into three categories. When a headline says 'Antarctic ice hits a record minimum', the meaning changes completely depending on whether it refers to ice floating on the sea or ice resting on land. The former is a seasonal phenomenon — something like a change of clothes each year. The latter is a change that unfolds over decades to centuries and is hard to undo.
Sea ice — the frozen ocean surface that swells with the seasons
Sea ice forms when the surface of the ocean surrounding Antarctica freezes. It is typically one to two metres thick, expanding to its maximum in the southern winter (around September) and shrinking to its minimum in summer (around February). The swing is remarkable: at maximum it covers an area of ocean larger than the continent itself, and at minimum it shrinks to roughly a sixth of that. It is one of the largest seasonal changes anywhere on Earth, and it is what makes Antarctica look like a continent that breathes once a year.
Because sea ice already floats on the ocean, melting it barely raises sea level at all — the same reason ice cubes melting in a glass do not change the water line. Sea ice matters anyway, because it is (1) a white lid that reflects sunlight and cools the planet, (2) a home and pasture on its underside for living things, (3) a buffer protecting ice shelves from waves, and (4) a machine that expels salt as it freezes and thereby manufactures dense deep water. Not raising sea level does not make its loss a small matter.
- Thickness: roughly 1–2 m (several metres where deformation piles it up)
- Seasonal cycle: maximum in winter, minimum in summer, with a very large swing
- Direct effect on sea level: essentially zero (it is already floating)
- Ecological role: habitat for ice algae, overwintering ground for krill larvae, breeding platform for penguins and seals
Ice shelves — land ice pushed out over the sea as a floating lid
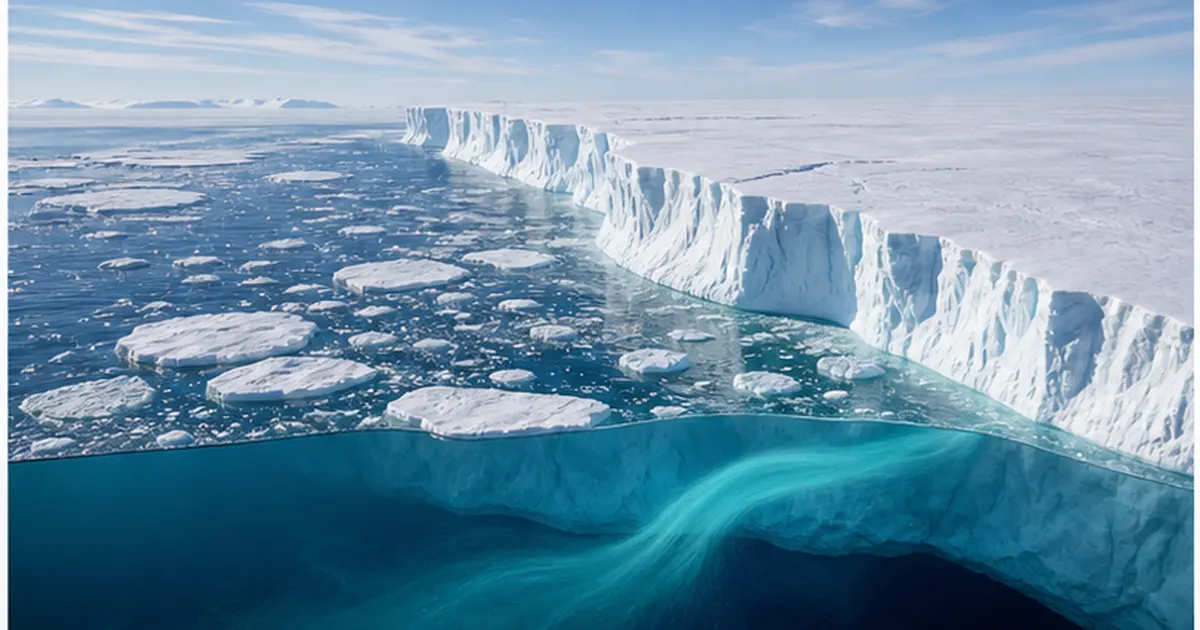
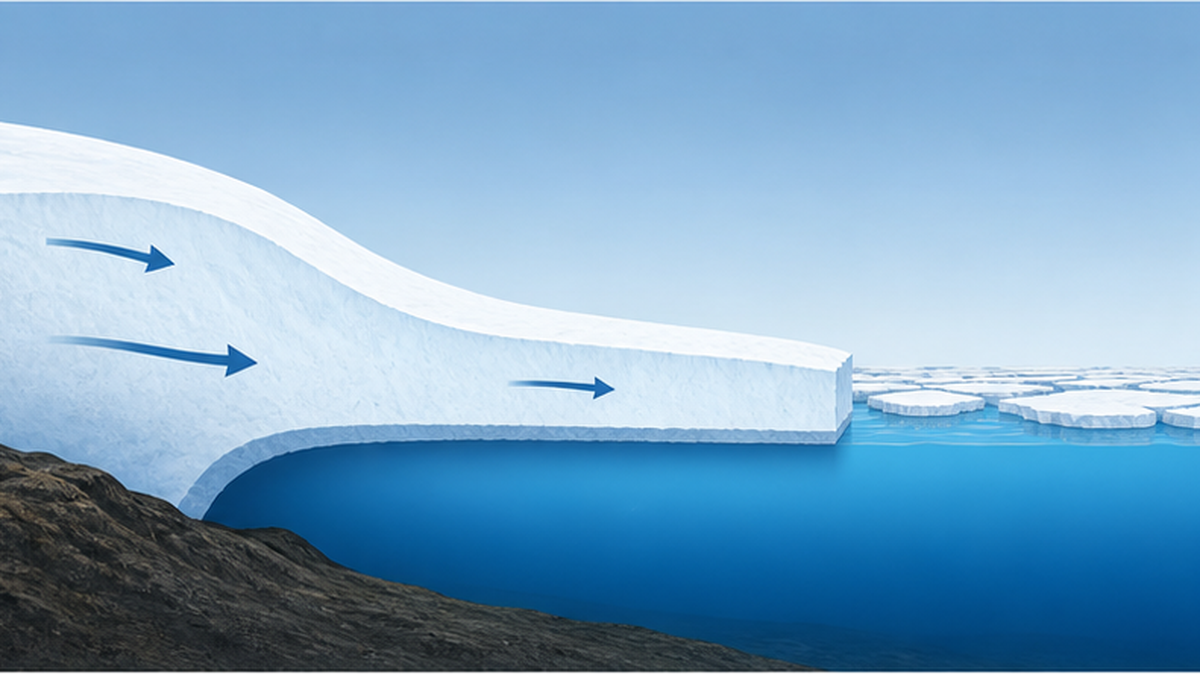
An ice shelf is where the continental ice sheet flows out to sea and spreads as a thick slab floating on the water. Shelves reach hundreds of metres in thickness and fringe wide stretches of the Antarctic coast. Because they too already float, melting them does not directly raise sea level. But ice shelves have another, decisive job: they act as a plug that holds back the land ice behind them.
When a shelf thins or collapses, that resistance — known as the buttressing effect — weakens, and the glaciers behind it accelerate into the sea. In other words, ice shelf melt acts as the trigger for sea level rise. Ice that should not raise sea level ends up setting the pace of sea level rise. This indirect linkage is one of the most important mechanisms to grasp about Antarctica.
The ice sheet — 58 metres of sea level stacked on land
The ice sheet is the mass of ice covering the Antarctic continent itself. It averages around 2,000 metres thick and exceeds 4,000 metres at its deepest. Built up over tens of thousands of years from compacted snowfall, the water it contains is the real substance of sea level rise. Whatever the ice sheet loses, global sea level gains.
The ice sheet divides broadly into East Antarctica (the eastern hemisphere side) and West Antarctica, and the two have different characters. East Antarctica is high and cold, and was long considered stable. West Antarctica, by contrast, has large areas where the base of the ice rests on bedrock below sea level, a configuration that lets warm ocean water reach in. This difference in geometry feeds directly into the later question of where the risk lies.
| Type | Where it is / how it forms | Direct effect on sea level | Main ecological role | Timescale of change |
|---|---|---|---|---|
| Sea ice | The ocean surface freezes; 1–2 m thick | Essentially none (already floating) | Life support for ice algae, krill larvae and penguins | Seasons to a few years (fast) |
| Ice shelf | Ice sheet extends over the sea and floats; hundreds of metres thick | Essentially none (already floating) | Shields sea ice; hosts distinctive sub-shelf life | Years to decades (important as a trigger) |
| Ice sheet | Snow accumulates on the continent; ~2,000 m thick on average | Large (58 m+ if fully melted) | Meltwater reshapes the coastal environment | Decades to millennia (slow but irreversible) |
Hold on to this and you will not get confused
- Only the ice sheet (land ice) raises sea level
- The ice shelves are the plug that sets how fast it drains
- The sea ice is what directly supports living things
- A headline about 'record minimum Antarctic ice' almost always means sea ice
What Changed in 2016: The Sudden Turn in Antarctic Sea Ice
While Arctic sea ice has declined over the long term, Antarctic sea ice was long treated as the exception. From the start of satellite observations in 1979 until around 2015, Antarctic sea ice extent showed a slight upward trend, and 2014 recorded the highest annual mean of the observation period. Ice growing in Antarctica in the middle of global warming was one of the harder puzzles in climate science.
The abrupt 2016 decline and the record lows that followed
That trend broke abruptly in 2016. Sea ice extent fell sharply that year, and low values have persisted ever since. February 2022 and February 2023 both delivered near-record minima, and 21 February 2023 set the smallest minimum extent in the satellite record. Nor is the decline confined to summer. According to NOAA, the winter maximum in September 2024 was the second smallest on record, falling about 1.55 million square kilometres below the 1981–2010 average maximum — an area roughly four times the size of Japan missing even at the height of winter.
2026 came back toward average — so is it over?
The most recent picture has a slightly different colour. According to analysis by the US National Snow and Ice Data Center (NSIDC), Antarctic sea ice reached its 2026 minimum of 2.58 million square kilometres on 26 February, the sixteenth lowest in the 48-year satellite record. That is 260,000 square kilometres below the 1981–2010 average, but 730,000 square kilometres above the record low of 21 February 2023 — much closer to average than the extreme past four years. Strong southerly winds in the Weddell Sea during January and February, which pushed ice outward, also shaped that year's trajectory.
How to read this 'rebound' calls for care. As NSIDC itself notes, Antarctic sea ice varies enormously from year to year, and a near-average year following extreme ones is not unexpected. Equally, one year cannot tell us that anything has 'recovered' or 'ended'. What matters is not a single figure but whether the lower baseline established after 2016 is still in place.
| Period | What happened | Figures and context |
|---|---|---|
| 1979–2015 | First half of the satellite era; a gentle upward trend, unlike the Arctic | 2014 had the highest annual mean of the period |
| 2016 | Abrupt decline; a turning point after which low values persist | The upward trend clearly breaks |
| Feb 2022 and Feb 2023 | Near-record minima in consecutive years | 21 February 2023 was the lowest minimum on record |
| September 2024 | Second smallest winter maximum on record | About 1.55 million km² below the 1981–2010 average (NOAA) |
| 26 February 2026 | Minimum extent returns toward average | 2.58 million km² / 16th lowest in 48 years / about 260,000 km² below average (NSIDC) |
Why the sudden drop? Changes on the ocean side
The causes are still being worked out, but it was clear early on that wind alone could not explain them. A 2025 sea ice–ocean modelling study by Kazuya Kusahara and colleagues at the Japan Agency for Marine-Earth Science and Technology (JAMSTEC) identifies thermal conditions — in particular rising sea surface temperatures in the subpolar zone north of the ice edge — as the dominant driver of the abrupt and sustained 2016–2023 decline. In that picture, Antarctic sea ice is being eaten away from its outer edge by a warmer surrounding ocean, not only by the air above.
This matters because heat in the ocean is far harder to shed than heat in the air. Even if strong winds spread the ice out in a given year, warm water beneath means only thin ice can form the following year. Thinner ice melts more readily in summer; open water absorbs solar heat and warms the ocean further. Stacked up, that is how a baseline shift appears rather than mere year-to-year noise.
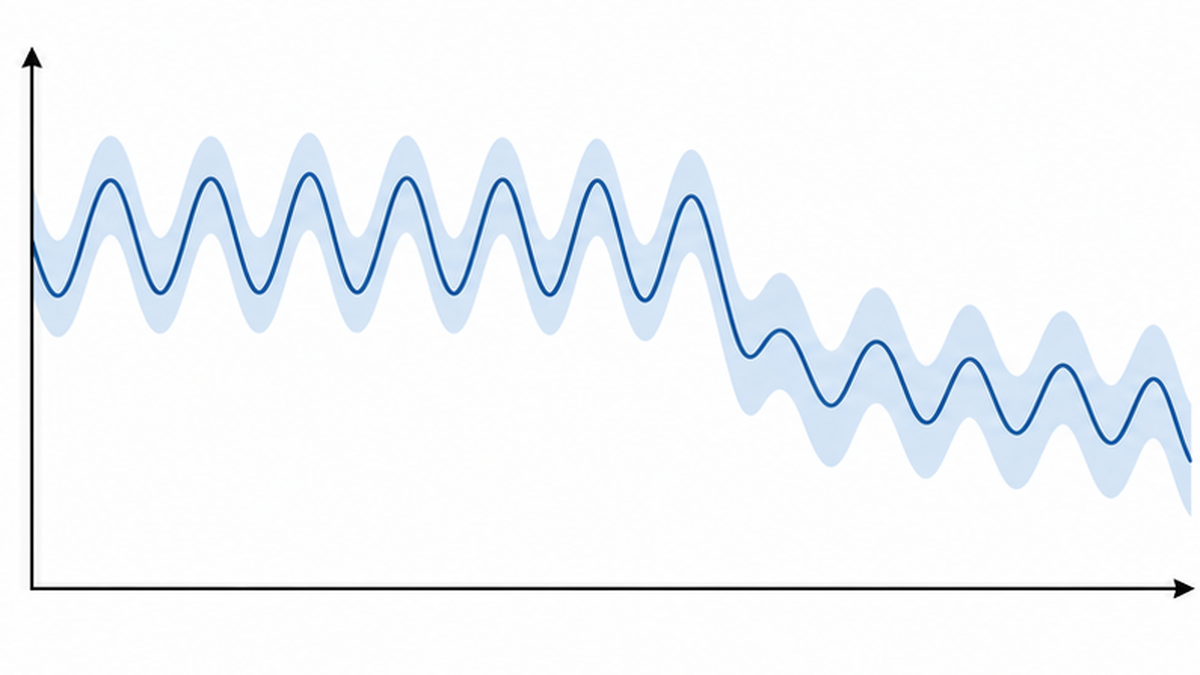
How to read a year that 'returned to average'
Antarctic sea ice swings so widely between years that a near-average year is unremarkable. What actually informs judgement is (1) the decadal baseline, (2) the trajectory of the winter maximum, and (3) ice thickness and subsurface water temperature. In this field especially, it is important not to declare either 'recovery' or 'crisis' from a single year's minimum extent.
The Underside of the Ice Is a Pasture: Ice Algae and Antarctic Krill
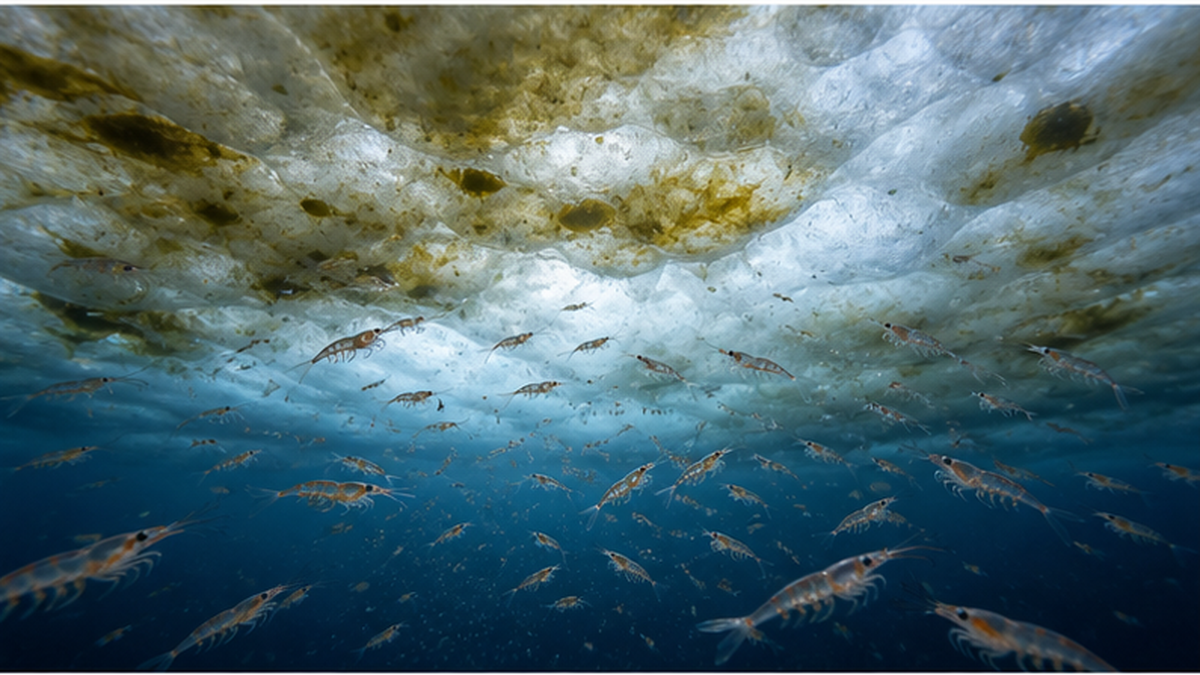
Sea ice matters to the ecosystem for more than being a floor to stand on. More fundamentally, the underside of the ice is a site of production. Look up at Antarctic sea ice from below and the base is sometimes stained brown or yellow-green: colonies of ice algae, microalgae that grow within and beneath the ice.
Algae on the base of the ice, carrying the dim season
Winter in the Southern Ocean means a low sun, a lid of sea ice, and wind-driven mixing that stirs surface water down to depth. For phytoplankton it is a harsh season: too little light, and a tendency to sink out of it. Ice algae, however, are fixed to sea ice — a float — and so remain at the very top of the water column, where light is greatest. The narrow brine channels formed as sea ice freezes also concentrate nutrients, so light and nutrition arrive together.
When the ice begins to melt in spring, these algae are released into the water and seed the large phytoplankton blooms that follow the retreating ice edge. As the edge moves south with the season, a conveyor belt of production travels toward the continent. The Southern Ocean's high productivity rests on this coupling of ice and growth.
Krill larvae overwinter beneath the ice
The most direct beneficiary of those ice algae is the larval stage of Antarctic krill (Euphausia superba). Only millimetres long, larvae cannot store the lipids adults can and cannot survive prolonged starvation. To get through a winter with little food in the water column, larvae have been observed clinging to the underside of sea ice and scraping ice algae off it. A study in the peer-reviewed journal Frontiers in Marine Science used isotope analysis to show that carbon derived from ice algae is critical to krill overwintering.
The story is not simple, though. A study in Nature Ecology & Evolution characterised the winter pack-ice zone as a habitat that is sheltered from predators but poor in food. The rugged underside of the ice makes an excellent hiding place, yet how much food it yields varies greatly by place and by year. Recent work shows that in areas such as the Bransfield Strait, larvae can meet their needs on water-column phytoplankton regardless of how much sea ice is present. There is no straight line from 'less sea ice' to 'fewer krill' — which is precisely why region-by-region measurement is needed.
Enormous biomass, but the distribution has shifted south
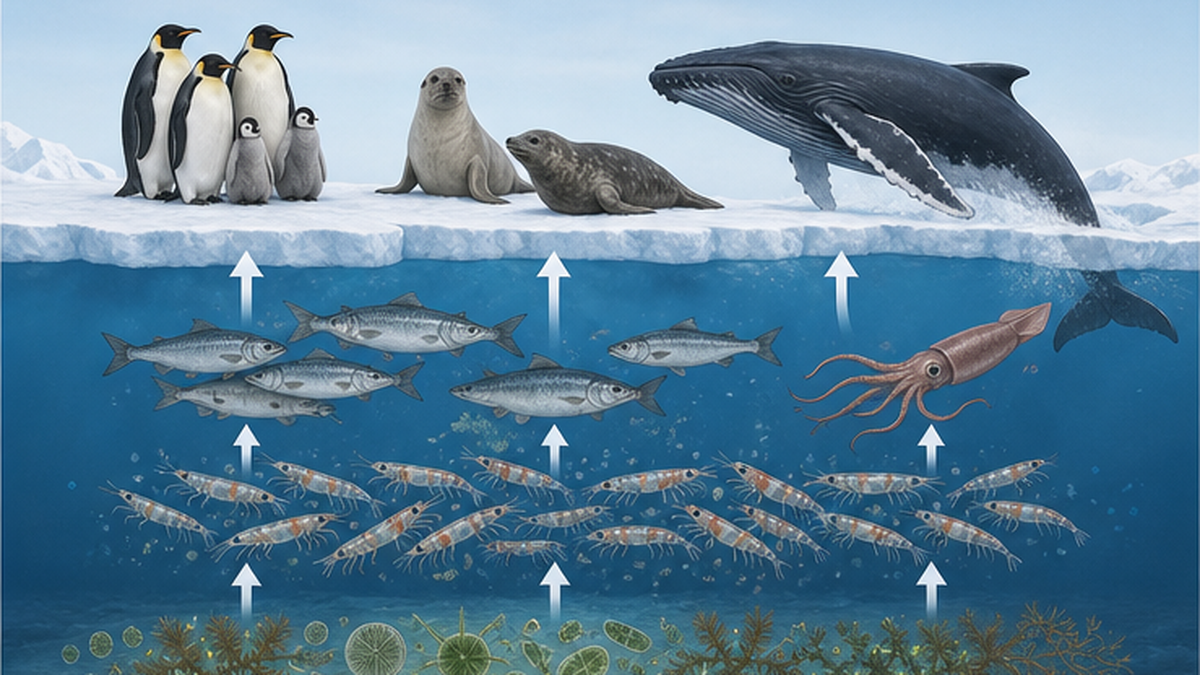
The circumpolar biomass of Antarctic krill is best estimated at about 379 million tonnes, making it one of the most abundant wild animal species on Earth. In the southwest Atlantic sector, the main fishing ground, an acoustic survey in 2019 estimated 62.6 million tonnes (coefficient of variation 13%). That vast biomass feeds virtually every upper-level predator in the Southern Ocean: whales, seals, penguins, fish, squid and seabirds.
At the same time, multiple analyses show a southward contraction of krill distribution over four decades. In the Atlantic sector in particular, abundance declined at the northern edge of the habitat between the 1970s and the 2010s. Populations further south have been relatively stable, so it is not accurate to say the species has simply declined; but a distribution centre shifting toward the continent means that feeding grounds move farther away for penguins and fur seals breeding on northern islands. For krill ecology and its place in the food web in more depth, see why Antarctic krill hold up the Southern Ocean.
What it means that the food web is 'short'
- Ice algae and phytoplankton → krill → top predators: very few steps
- Few steps are efficient, but a change in one species propagates through everything
- Krill are both food and a carrier that moves carbon into the deep ocean
- Sea ice loss removes the feeding ground and the hiding place at the same time
The Ripple Reaching Top Predators: Emperor Penguin Breeding Failure
The clearest record yet of sea ice loss affecting the ecosystem is the breeding failure of emperor penguins. Rather than a statistical trend, this case documents what happened in a specific year and a specific region, tracked by satellite — which is why it occupies such an important place.
In 2022, four of five colonies raised no chicks
Peter Fretwell and colleagues at the British Antarctic Survey used satellite imagery from 2018 to 2022 to monitor five emperor penguin colonies in the Bellingshausen Sea, west of the Antarctic Peninsula, through each breeding season. They found that in the 2022 season four of the five colonies fledged no chicks at all. In the central and eastern parts of that region, 100% of the sea ice was lost in November 2022. The findings were published in 2023 in the peer-reviewed journal Communications Earth & Environment.
What made the report a landmark is that it was the first clear record linking large-scale contraction of sea ice extent to widespread breeding failure in emperor penguins. Population estimates always carry ranges, but 'no chicks fledged' leaves little room for interpretation and shows directly how the impact arrives.
Why the ice has to be the kind that does not move
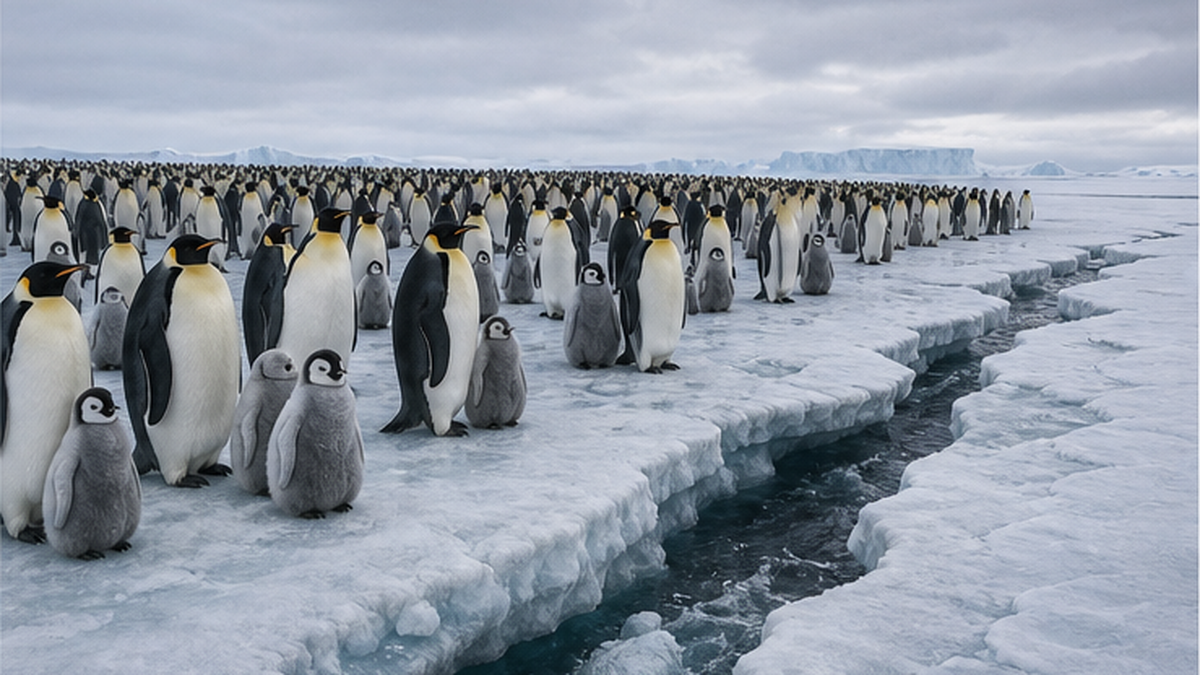
Emperor penguins breed on sea ice that is fastened to land — fast ice. Their schedule is extremely tight: they need stable ice from roughly April through the following January to complete laying, incubation, chick rearing and moult. Most decisive of all, chicks do not develop waterproof feathers until just before fledging. If the ice breaks up earlier and they fall into the sea, they cannot maintain body temperature and cannot swim.
What emperor penguins need, then, is not simply that ice exists but that it stays unbroken for as long as required. Even with average total extent, breeding fails if timing and stability collapse. There is a fragility here that an extent figure alone cannot capture.
The chain widening to seals, whales and seabirds
The same logic applies to other animals. Weddell seals and crabeater seals use sea ice for pupping and resting, and crabeater seals — despite the name — feed mainly on krill. Humpback and fin whales consume large volumes of krill in the summer Southern Ocean and rely on the fat they build there for long migrations and for breeding. For Adélie penguins, foraging distances vary greatly with ice conditions, so breeding success depends on how the ice is arranged in a given year.
All of these species are long-lived, and one failed year does not erase a population. But in species like emperor penguins that need a long stretch for breeding, consecutive failures translate directly into population decline. For Antarctica's large animals, instability in the sea ice foundation can hit harder than a shortage of food.
What an extent figure cannot show
- What matters is not only area but when, where and for how long the ice stayed stable
- Emperor penguins need fast ice roughly from April to the following January
- Chick feathers become waterproof only just before fledging, so early break-up is fatal
- In long-lived species, consecutive failed years drive population decline
Ice Shelves Are the Ice Sheet's Plug: Warm Water Melting From Below
From here the story moves to the ice sheet, the substance of sea level rise. The ice sheet is not melting from its surface: inland Antarctica averages tens of degrees below zero, and surface melt occurs only in limited coastal areas. Yet the ice sheet is losing mass. The reason is that the parts in contact with the ocean are being melted from below, and land ice is flowing to sea faster as a result.
Loosen the plug and the ice behind it accelerates
Ice shelves float, but their sides and bases touch seafloor highs and the walls of bays, generating friction that brakes the glaciers behind them. This is the buttressing effect. When a shelf thins, or collapses and loses that support, the glaciers behind accelerate into the ocean, the ice sheet loses that mass, and sea level rises. The shelf itself raises no sea level, yet changes in the shelf govern the speed of sea level rise — an indirect causality that makes Antarctica such a hard continent to predict.
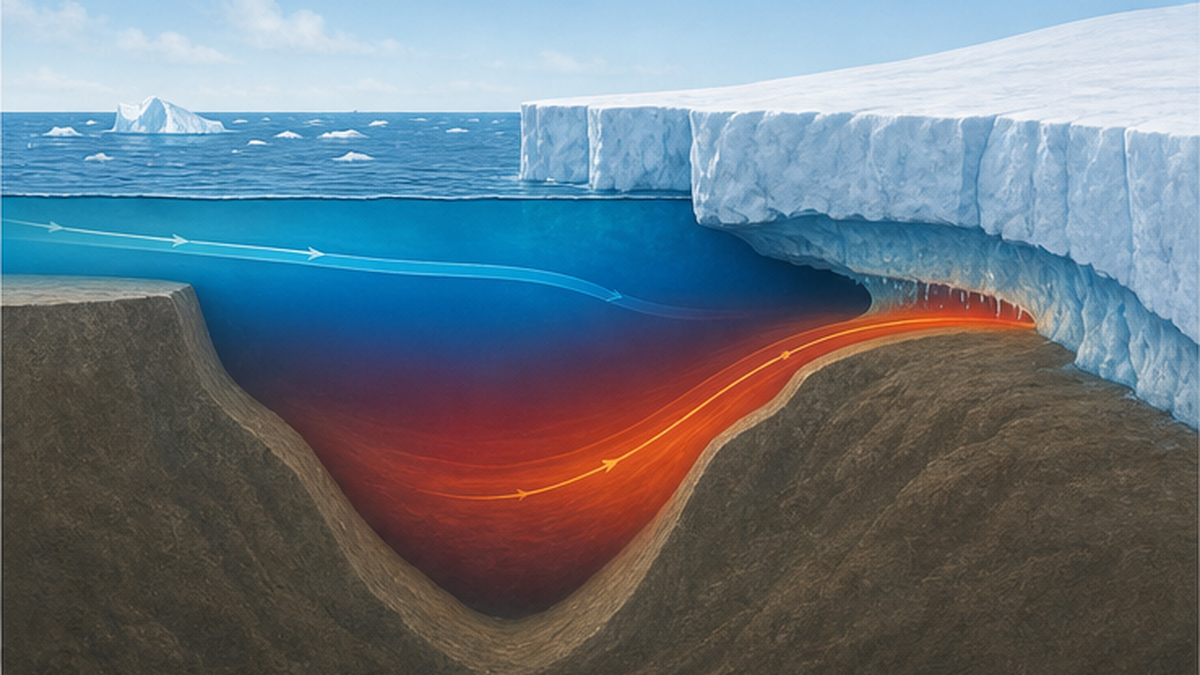
The main agent thinning the shelves is the ocean, not the atmosphere. Circumpolar Deep Water (CDW), which circles the continent, is several degrees above the freezing point. When that water rides up onto the continental shelf and enters the cavity beneath an ice shelf, the ice is shaved away from its base. Here geometry is decisive: if deep troughs are carved into the continental shelf and continue under the shelf, warm water uses them as a route to reach far inland.
Totten Glacier in East Antarctica — the 'heat pathway' traced by Japanese research
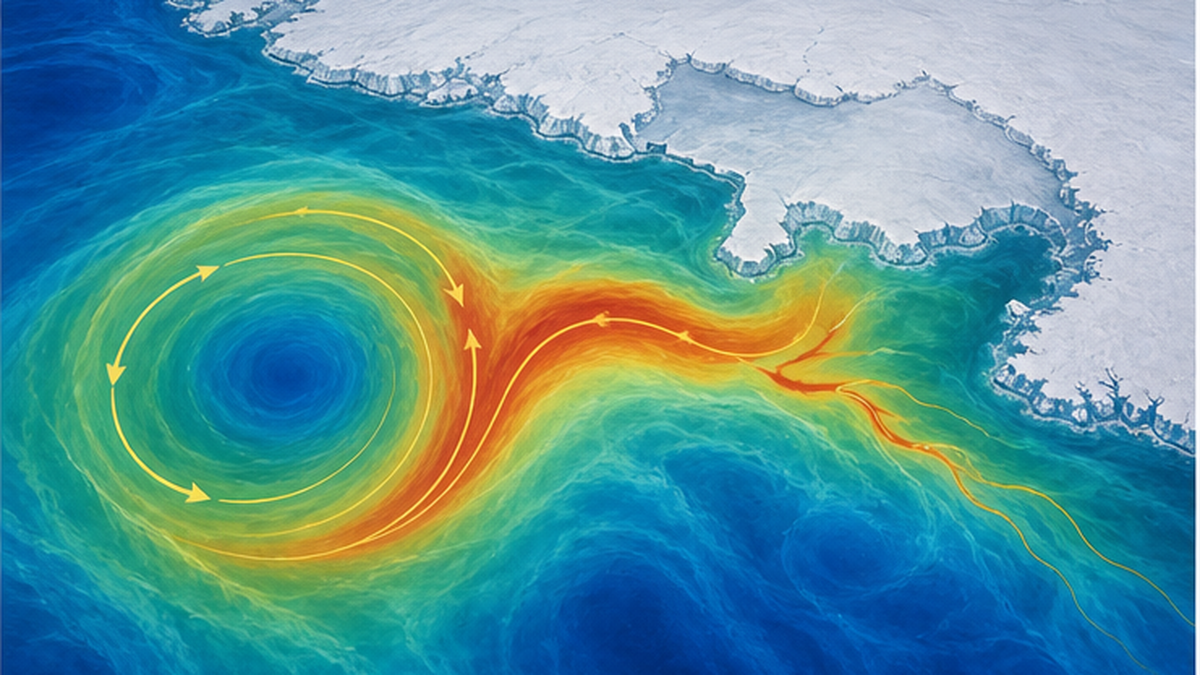
It was a Japanese team that drew that heat pathway concretely. Kohei Mizobata of Tokyo University of Marine Science and Technology, Shigeru Aoki of the Institute of Low Temperature Science at Hokkaido University and colleagues combined in-situ observations with satellite data and showed in 2021 that a huge, quasi-stationary ocean eddy offshore of Totten Glacier — one of the largest in East Antarctica — efficiently transports relatively warm water toward the continent (announced by the National Institute of Polar Research). That eddy was identified as a principal source of the heat melting the shelf from below.
A follow-up announcement in 2023 laid out the specific route: warm water circulates clockwise along a deep, bowl-shaped bathymetric feature on the continental shelf, and part of it flows beneath Totten Glacier through a locally deep trough in front of the glacier. Although Totten sits in East Antarctica, the ice held behind it is equivalent to roughly four metres of sea level rise. This was also the process by which the assumption that 'East Antarctica is stable' was rewritten by observation.
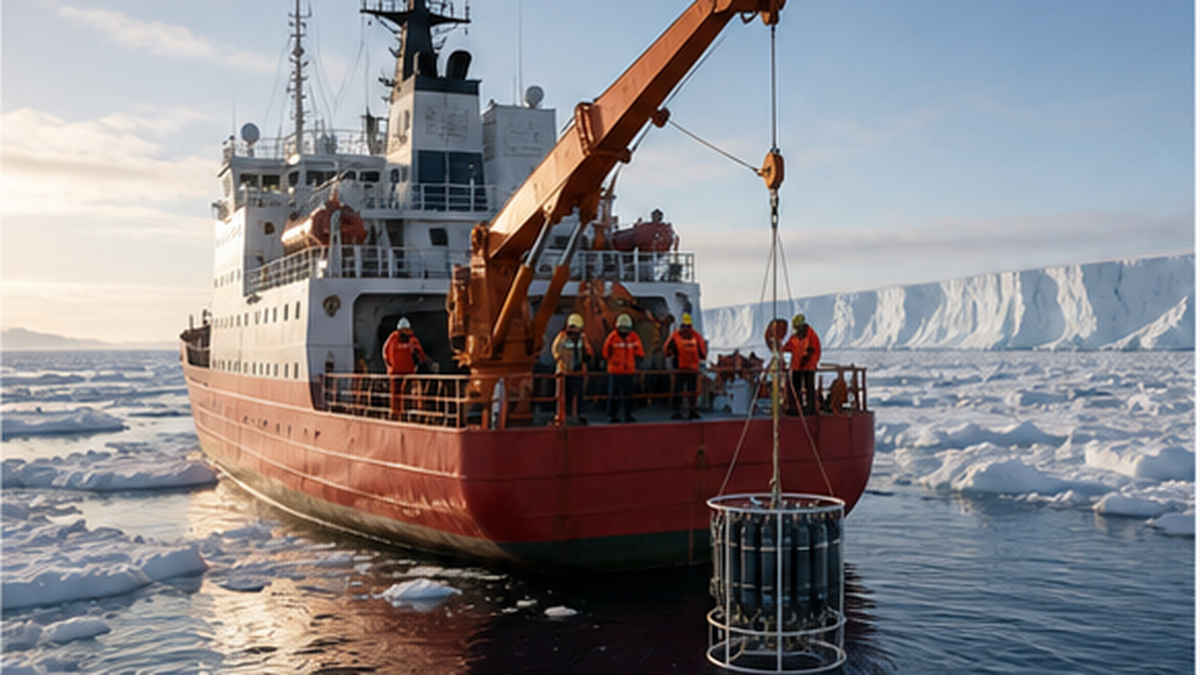
It is worth noting that this work rests on Japanese observation: voyages of the icebreaker Shirase, helicopter surveys of waters an icebreaker cannot reach, and year-round mooring measurements. Patient data collection in a punishing environment is what improves the accuracy of global projections.
Thwaites Glacier in West Antarctica — the worry called marine ice sheet instability
In West Antarctica, Thwaites Glacier and Pine Island Glacier draw the most attention. The ice in Thwaites' catchment rests on bedrock that lies below sea level and deepens inland. In that configuration, retreat thickens the ice near the grounding line — the boundary where ice leaves the bed and begins to float — increasing discharge and driving further retreat, a self-amplifying loop. This is marine ice sheet instability (MISI). The ice held by Thwaites Glacier alone is equivalent to more than half a metre of global sea level rise.
Understanding here has not moved in one direction, however. Direct measurements in the grounding zone of eastern Thwaites have reported places where basal melt is more suppressed than expected. Because melt depends strongly on cavity shape and water circulation, 'warm water arrives, therefore everything melts uniformly' is not a valid simplification. Large uncertainty does not mean small danger; it means the outcome could fall on either side.
| Location | Region | Why it draws attention | Approximate sea level equivalent held |
|---|---|---|---|
| Totten Glacier | East Antarctica | An offshore ocean eddy delivers warm water that enters the sub-shelf cavity via a deep trough | About 4 m |
| Thwaites Glacier | West Antarctica | Rests on bedrock deepening inland; risk of marine ice sheet instability | More than 0.5 m |
| Pine Island Glacier | West Antarctica | Large basal melt beneath the shelf; accelerating ice discharge | A major contributor alongside Thwaites |
Sea Level Rise: Why Antarctica Is the Biggest Uncertainty
So how much ice has Antarctica actually lost, and how much has it raised sea level? This is where numbers most easily tangle. Values differ by method — gravimetric satellites, altimetry, the mass budget approach — and trends shift with the period chosen. That is exactly why it pays to know which number measures what.
The mass loss now being observed
According to climate indicators compiled by the Copernicus Climate Change Service, between 1979 and the end of 2024 the Antarctic Ice Sheet lost a total of 4,876 ± 530 gigatonnes of ice, raising global mean sea level by 13.5 ± 1.5 millimetres. Data from NASA's GRACE gravity satellites give an average loss of about 150 gigatonnes per year from 2002 to 2020, equivalent to 0.4 millimetres of sea level rise per year. IMBIE, the international collaboration that combined 24 satellite surveys with 80 scientists from 42 institutions, reported that the rate of loss tripled after 2012 to about 219 gigatonnes per year, or 0.6 millimetres of sea level per year.
At the same time, the record is not monotonic. Regional analyses of GRACE data report that a loss of 142.06 ± 56.12 gigatonnes per year during 2011–2020 flipped to a mass gain of 107.79 ± 74.90 gigatonnes per year during 2021–2023. Increased snowfall in parts of East Antarctica is thought to be the main reason — one of the expected effects of a warming atmosphere holding more water vapour and delivering more snow to Antarctica. That gain does not cancel the loss; it shows how large the multi-year variability is.
Why the outlook for 2100 is so wide
The range in projections remains, frankly, large. Estimates from ISMIP6, the international ice sheet model intercomparison, put the Antarctic contribution through 2100 at anywhere from −5 to +43 centimetres of sea level equivalent under a high-emissions scenario. The negative end exists because increased snowfall could outweigh increased discharge. That breadth is precisely why Antarctica is the largest single uncertainty in global sea level projections.
A further debate concerns marine ice cliff instability (MICI): the idea that once shelves are gone and tall ice cliffs are exposed, they collapse under their own weight and retreat accelerates sharply. If that process operates in reality, Antarctica's contribution could exceed the range above and, it has been argued, could double the total. Whether MICI matters much is unsettled. The IPCC's overall outlook is that global mean sea level rises by roughly 0.5 to 1 metre by 2100 depending on emissions, a figure that includes all ice sheet and glacier melt plus the thermal expansion of seawater.
What that means for Japan's coasts
Half a metre or a metre may sound modest as a statement about everyday water levels. But coastal disaster damage is set not by mean water level but by extremes — storm surge, high waves and spring tides arriving together. A higher mean level directly raises how far the same typhoon reaches. Flooded area in low-lying land, freeboard on seawalls, beach retreat, saltwater intrusion into groundwater, the limits of drainage systems: the effects land harder than the rise itself. For what this means on Japanese coasts specifically, see sea level rise and Japan's coastline.
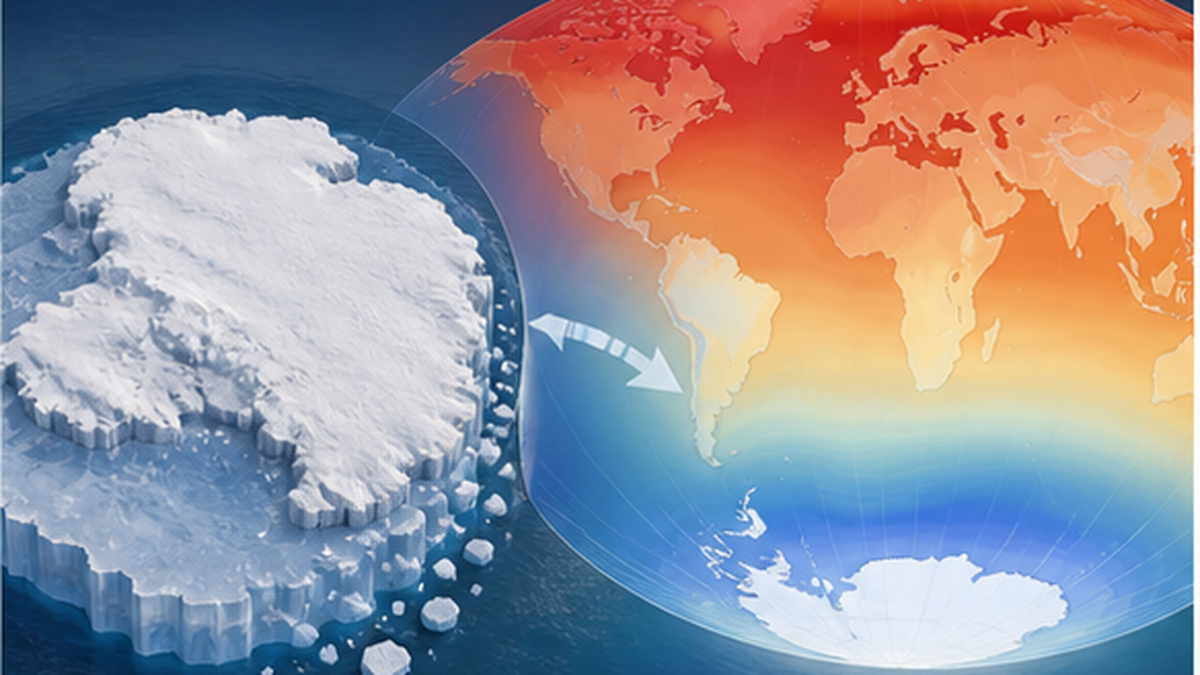
One more point deserves attention: sea level rise from Antarctic melt is not uniform across the globe. A vast ice sheet gravitationally attracts the surrounding ocean toward itself; as the ice shrinks, that attraction weakens, nearby sea level falls in relative terms, and distant sea level rises more. Through this gravitational effect, mid-latitude regions of the Northern Hemisphere far from Antarctica — including Japan — can experience rises above the global average. Antarctic change echoes in Japan more strongly than geographic distance would suggest.
Three cautions when reading the numbers
- The period changes the trend: a few years of mass gain does not negate long-term loss
- Methods measure different things: gravimetry, altimetry and mass budget are not the same quantity
- A wide range is not safety: −5 to +43 cm includes the possibility of the high end
Antarctica Is Connected to the World's Oceans and Climate
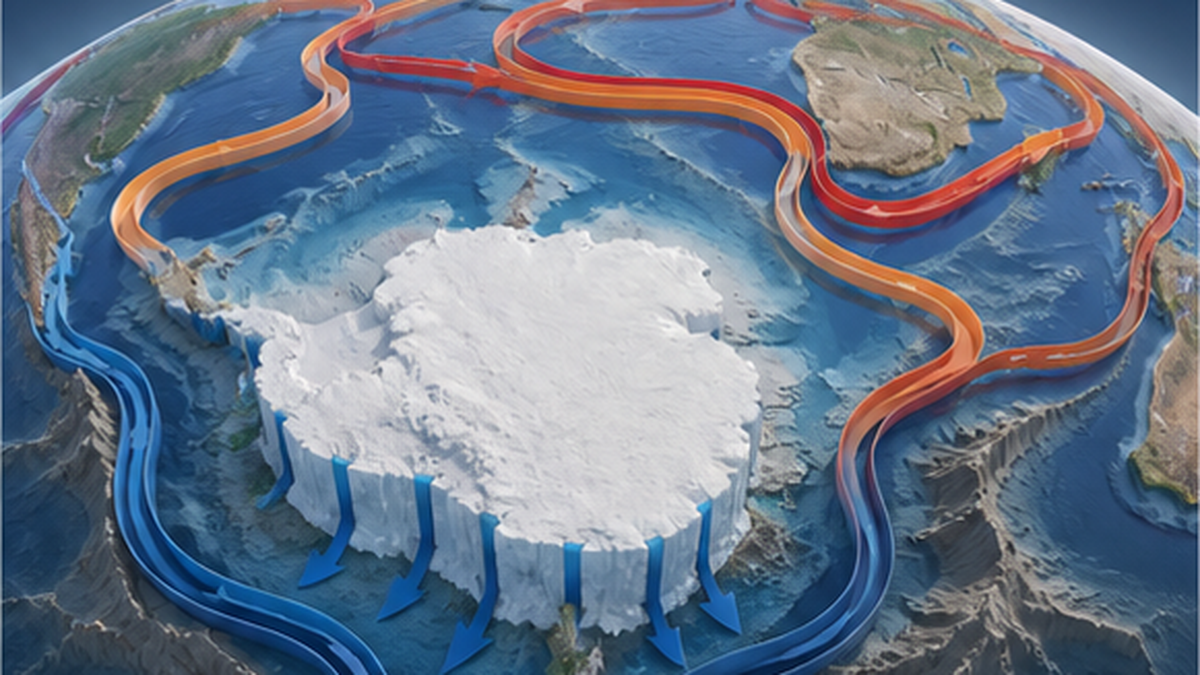
Antarctic change matters for more than sea level and local ecosystems. Antarctica is also the engine room that drives global ocean circulation and the distribution of heat. What happens there is transmitted across the equator to oceans worldwide.
Antarctic Bottom Water — the pump that moves the ocean floor
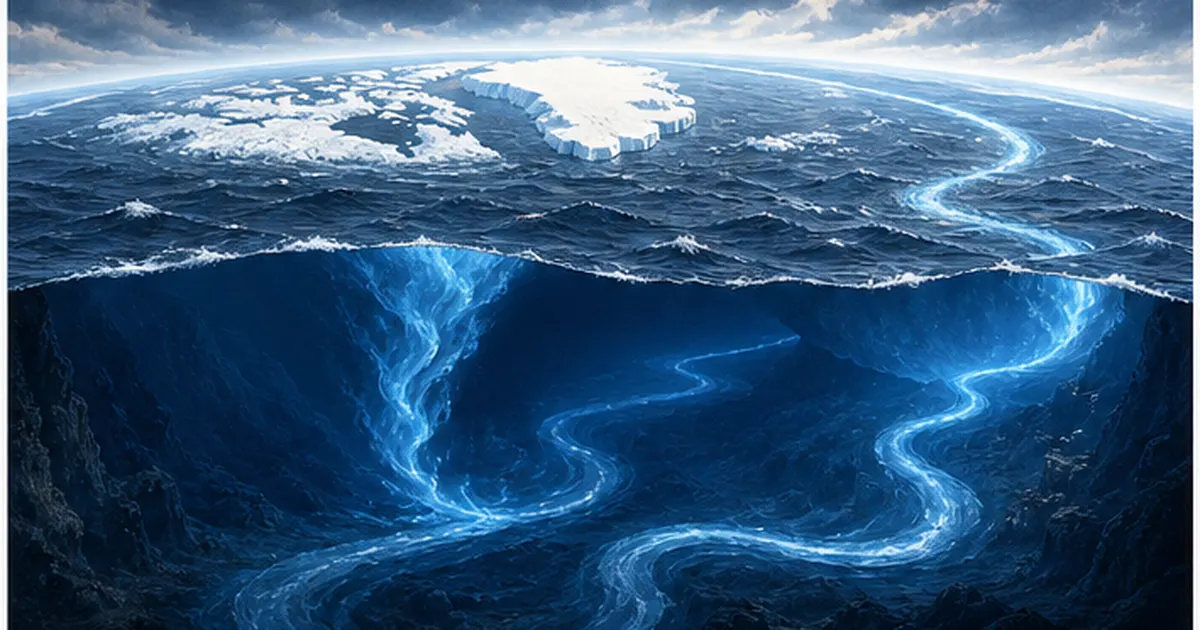
Along the Antarctic coast, salt expelled as sea ice freezes makes the surrounding water saltier, and extreme cold produces exceptionally dense water. This is Antarctic Bottom Water, the heaviest seawater on Earth, which spreads out along the floor of every ocean basin. It carries oxygen into the deep, stores heat and carbon for long periods, and acts as one of the two drivers of a global overturning circulation that operates on millennial timescales.
This bottom water is changing too. A joint team from the Institute of Low Temperature Science at Hokkaido University, JAMSTEC and Tokyo University of Marine Science and Technology confirmed that near the Antarctic continent in the Australian–Antarctic Basin, bottom salinity declined continuously from the 1970s into the early 2010s while the volume of bottom water also kept shrinking — a picture in which increased meltwater from ice sheets and shelves lightened the surface and made dense water harder to sink. Analysis by the same team published in Scientific Reports in 2020 also reported that this continuous freshening then halted and turned into a phase of rapidly increasing salinity. Ocean circulation does not change monotonically in one direction; it moves with large swings.
Weaker sinking means less oxygen delivered to the deep ocean and a weaker mechanism for carrying heat and carbon downward. Alongside the debated weakening of the thermohaline circulation (AMOC) on the Atlantic side, Antarctic sinking is the other pillar of the global overturning. What follows if both ends weaken at once is not yet clear.
Lose the white lid and the ocean starts absorbing heat
Another role of sea ice is to act as a mirror reflecting sunlight. Sea ice and snow surfaces reflect most incoming light, while open water absorbs most of it. As ice retreats and dark water spreads, the ocean takes up more heat from the same sunlight, water temperature rises, and ice becomes still harder to form. This ice–albedo feedback is usually discussed for the Arctic, but it operates in Antarctica through the seasons as well.
Less sea ice also lets waves reach closer to the coast. Because sea ice buffers ice shelf edges against waves, its retreat mechanically weakens those edges and makes collapse more likely. Sea ice (which does not raise sea level) weakens ice shelves (which also do not raise sea level), and that speeds the discharge of the ice sheet (which does). In Antarctica, such couplings appear everywhere.
A lesson from 9,000 years ago: melt begets melt
One study extracted that coupling from the past. In November 2025, a collaboration of 14 institutions led by Japan's National Institute of Polar Research combined seafloor sediment analysis with numerical modelling to show that around 9,000 years ago, warm deep water flowing in from offshore into a bay caused an ice shelf to collapse and triggered rapid retreat of the Antarctic Ice Sheet. They further identified a feedback in which meltwater strengthened the stratification of the seawater, which in turn promoted the inflow of deep water.
From this the team points out that the Antarctic Ice Sheet has a property whereby melting in one place promotes melting around it and spreads in a chain, so that a so-called tipping cascade can occur. This is not a claim that the world ends once a single threshold is crossed; it is a statement about a property in which local change propagates to its neighbours and the whole system moves in a direction that is hard to reverse. Part of the reason projections are so wide lies here.
How Can We Relate to a Continent So Far Away?
Antarctica belongs to no country; under the Antarctic Treaty it is open to peaceful use and scientific research. There is almost nothing an individual can do on site. Even so, actions that genuinely affect the fate of Antarctic ice do exist. If we are going to rank them, it seems honest to start with the ones that work best.
The most effective thing is still cutting emissions
The heat melting Antarctic ice is heat that added greenhouse gases have trapped on Earth. More than 90% of it is absorbed by the ocean and carried under ice shelves as Circumpolar Deep Water. In other words, emissions reductions act directly on Antarctic ice. That the ISMIP6 range varies so much with emissions scenario means, conversely, that our choices can still move what Antarctica looks like in 2100.
What individuals can do is unglamorous but real: switch electricity contracts to plans with a high renewable share, improve home insulation, shift travel toward rail and bicycles, cut food waste. None of it feels like it is 'for Antarctica', but all of it is consistent in acting on the total amount of heat. For how the ocean absorbs carbon and how far that capacity can hold, see the saturation of the ocean carbon sink.
Krill fishing and marine protected areas: how to handle Southern Ocean resources
Antarctic krill are harvested commercially in the Southern Ocean for aquaculture feed and krill oil supplements, among other uses. Management falls to the Commission for the Conservation of Antarctic Marine Living Resources (CCAMLR), and in the main fishing ground of the southwest Atlantic (Area 48) an annual catch limit of 620,000 tonnes has been in place since 1991. Against an estimated biomass of 62.6 million tonnes, that is on the order of 1% — modest in volume terms.
The issue is less the total than the overlap in place and time. Fishing concentrates where krill aggregate densely, and those areas tend to coincide with where penguins and fur seals forage during the breeding season. Even with room in the overall figure, locally thin food near a breeding colony hits top predators. In recent years there has been continued discussion — including a proposal published in PNAS — that catch limits should be redistributed in finer detail across areas and seasons. As consumers, we have the option of asking whether krill-derived supplements and feed are really necessary, and of checking certification and sourcing policies.
Keep observing — and keep knowing
Nearly every figure in this article comes from combining satellites with data measured by people who went there. Voyages of the icebreaker Shirase, year-round observations at Syowa Station, deploying and recovering moorings, helicopter surveys of waters an icebreaker cannot enter. The 'heat pathway' to Totten Glacier was uncovered because such patient observation accumulated. Japan's Antarctic research programme has continued since the first expedition in 1957, and its continuity is itself a public good underpinning the accuracy of global projections.
And knowing, in itself, has value. When you see a headline that Antarctic sea ice hit a record minimum, you can recognise that it is not about the ice that raises sea level but about the foundation for ice algae, krill and penguins. When you hear that Antarctic ice apparently increased, you can recognise that a separate process — more snowfall — is mixed in and does not negate long-term loss. That resolution alone keeps you from being swept into either extreme pessimism or easy optimism. Antarctica is not a frightening place; it is a strikingly finely engineered system. Knowing that precision is where the wish to protect it begins.
What you can do today
- Energy: switch to a plan with a high renewable share, insulate your home, upgrade to efficient appliances
- Travel: shift short car trips to rail, bicycle or walking
- Shopping: reconsider whether krill-derived supplements or feed are needed, and choose products that publish sourcing policies
- Information: get into the habit of checking NSIDC and the National Institute of Polar Research as primary sources
- Sharing: explain the difference between sea ice, ice shelves and the ice sheet to someone close to you, just once
Summary of this article
- Antarctica has three kinds of ice: the ice sheet raises sea level, the ice shelves set the pace, and the sea ice supports the ecosystem
- Antarctic sea ice dropped to a lower baseline after 2016 and hit a satellite-era record minimum on 21 February 2023; 2026 returned toward average at 2.58 million km² (16th lowest in 48 years), but one year settles nothing
- Ice algae on the underside of the ice support krill larvae through winter, and in 2022 four of five colonies in the Bellingshausen Sea fledged no emperor penguin chicks
- Ice shelves are being melted from below by warm deep water; at Totten Glacier, Japanese observations showed a huge offshore eddy is the carrier of that heat
- Between 1979 and 2024 the ice sheet lost 4,876 ± 530 Gt and raised sea level by 13.5 ± 1.5 mm; the contribution through 2100 spans −5 to +43 cm, making Antarctica the largest uncertainty
- Because of the gravitational effect, Japan — far from Antarctica — can see sea level rise above the global average
References and sources
- National Snow and Ice Data Center (NSIDC) – Antarctic sea ice extent arrives at a near-average minimum (2026 minimum of 2.58 million km² on 26 February, 16th lowest in 48 years)
- Communications Earth & Environment (Fretwell et al., 2023) – Record low 2022 Antarctic sea ice led to catastrophic breeding failure of emperor penguins
- British Antarctic Survey – Loss of sea ice causes catastrophic breeding failure for emperor penguins (study summary)
- National Institute of Polar Research, Japan – The route of warm water heading for one of East Antarctica's largest glaciers (22 August 2023, Totten Glacier)
- National Institute of Polar Research, Japan – A huge ocean eddy carries warm water toward the Antarctic continent (26 October 2021, with Tokyo University of Marine Science and Technology and Hokkaido University)
- National Institute of Polar Research, Japan – Melting of the Antarctic Ice Sheet begets further melting (7 November 2025, rapid retreat 9,000 years ago and tipping cascades)
- Copernicus Climate Change Service – Climate Indicators – Ice Sheets (4,876 ± 530 Gt lost from 1979 to 2024, raising sea level 13.5 ± 1.5 mm)
- Geophysical Research Letters (Kusahara et al., 2025) – Causes of the Abrupt and Sustained 2016–2023 Antarctic Sea-Ice Decline: A Sea Ice–Ocean Model Perspective
- Antarctic Environments Portal – Antarctic krill and its fishery: current status and challenges (biomass, southward shift, CCAMLR management)
- NOAA Climate.gov – 2024 Antarctic sea ice winter maximum second lowest on record
* Listed in order of reliability: government and academic institutions > peer-reviewed papers > specialist bodies > credible media