⚡ The answer in 30 seconds
- Sea surface temperature is measured by combining infrared satellites (SHIKISAI), microwave satellites (SHIZUKU), buoys and Argo floats, because any single method leaves gaps in cloud coverage, resolution or depth.
- Infrared sees fine detail at several hundred meters to 1 km but is blocked by clouds; microwave sees through clouds but is coarse, at tens of kilometers. They complement each other.
- About 4,000 Argo floats observe down to 2,000 m about every 10 days, revealing how much heat the ocean has stored.
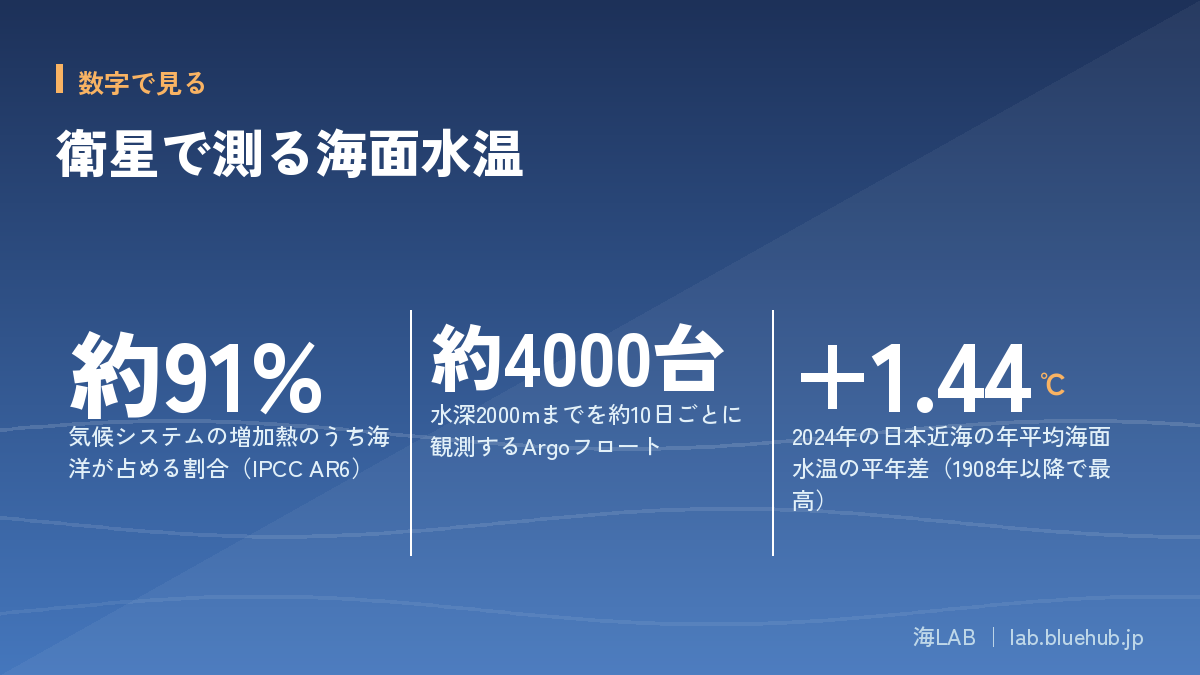
- The IPCC assesses that the ocean absorbed about 91% of the increase in heat in the climate system. The seas around Japan are warming faster than the global average.
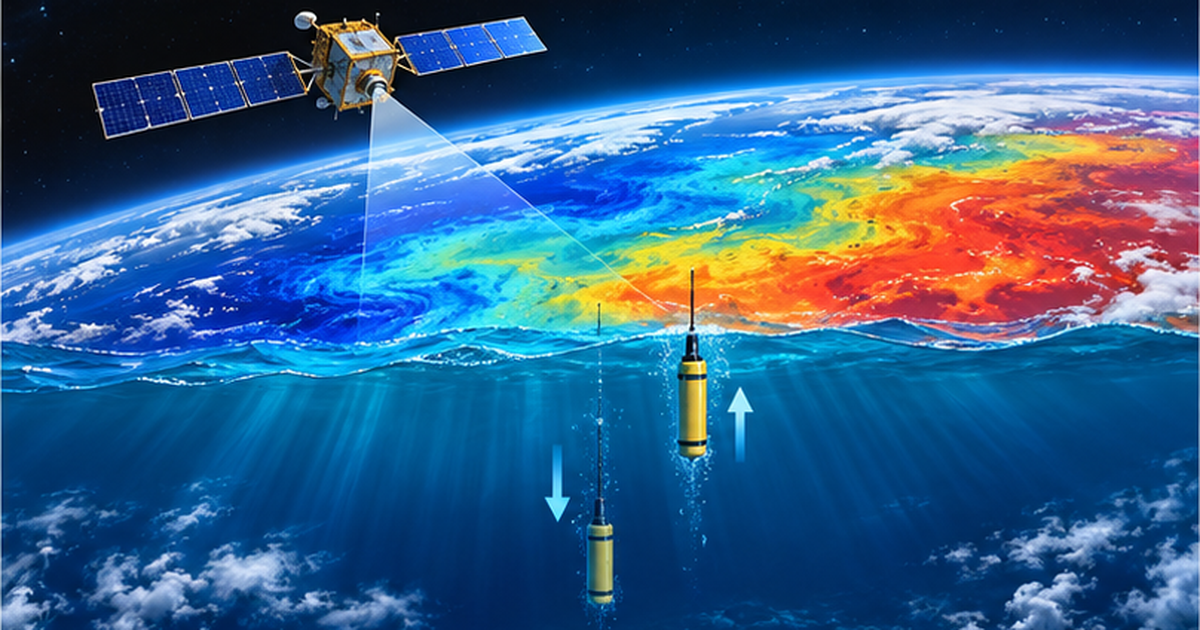
How is sea surface temperature measured from space? The infrared satellite SHIKISAI, the microwave satellite SHIZUKU and Argo floats diving beneath the surface share the work of tracking ocean warming.
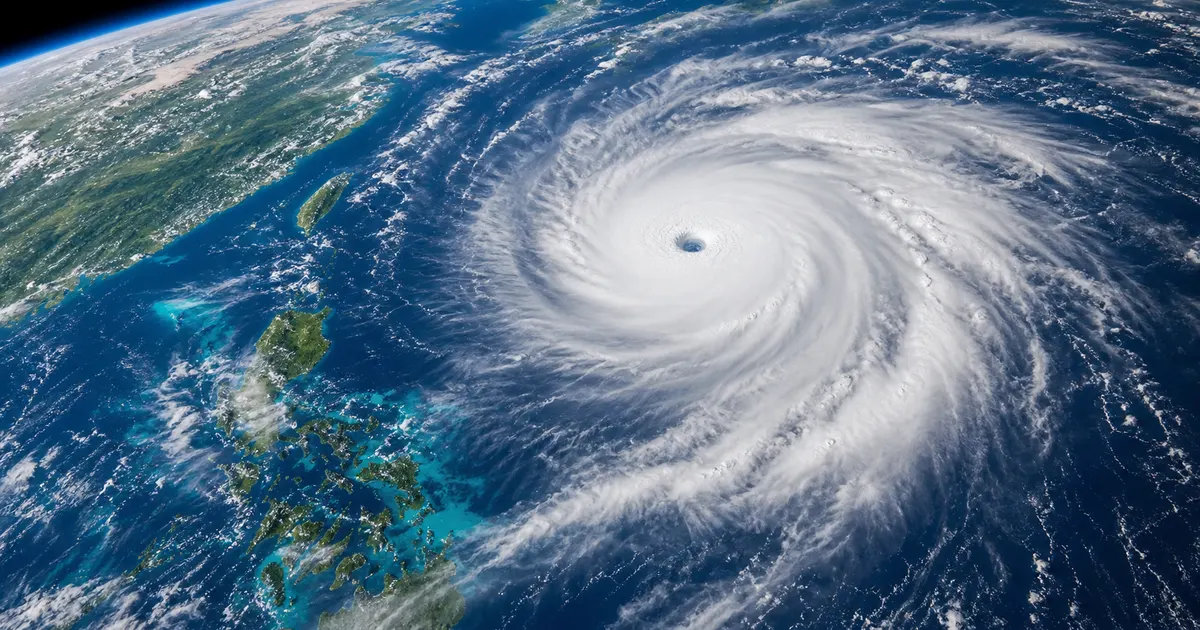
The ocean takes up most of the extra heat from global warming, and its temperature is closely tied to typhoons, fisheries and coral bleaching. Understanding the observations explains what "record-high sea surface temperature" in the news really means.
Based on public sources from JAXA, JAMSTEC, the Japan Meteorological Agency and the IPCC, this article summarizes how satellites and Argo work, their strengths and limits, and the figures they reveal.
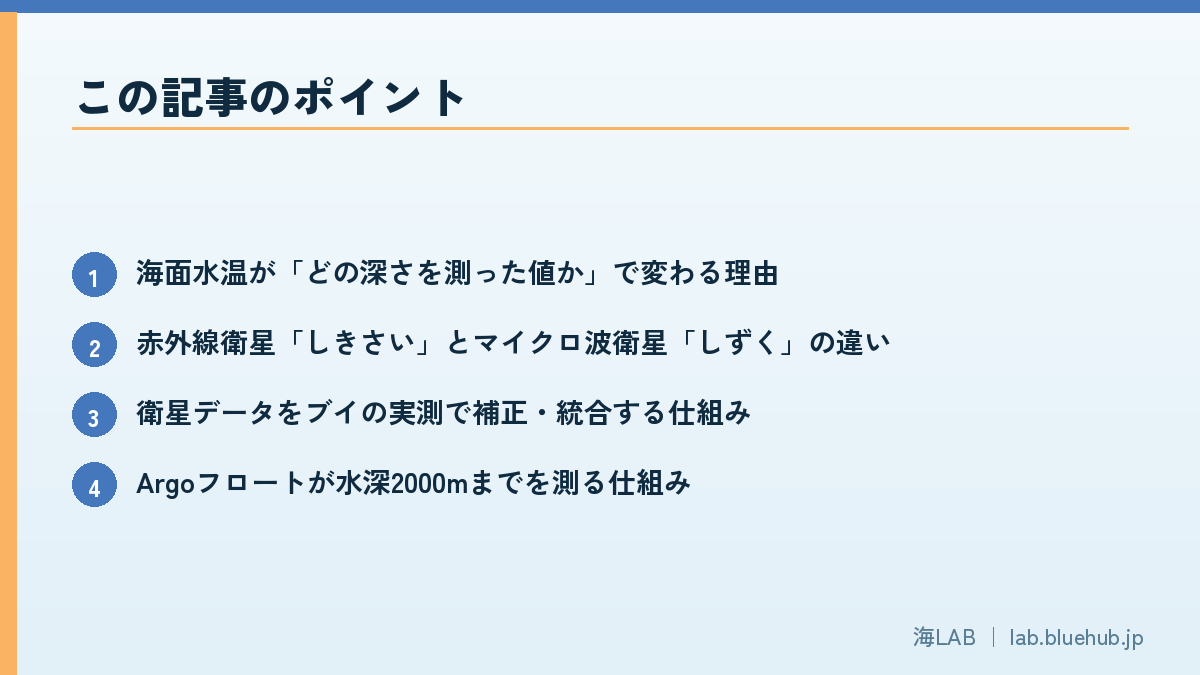
What you will learn
- Why sea surface temperature depends on the depth being measured
- Differences between the infrared satellite SHIKISAI and the microwave satellite SHIZUKU
- How satellite data are corrected and merged using buoy measurements
- How Argo floats measure down to 2,000 m
- What observations show about ocean warming, and warming around Japan
- Uses in weather forecasting, fisheries and coral conservation
What is sea surface temperature, and why take the ocean's "body temperature"?
Definition of SST, and how values change with measurement depth
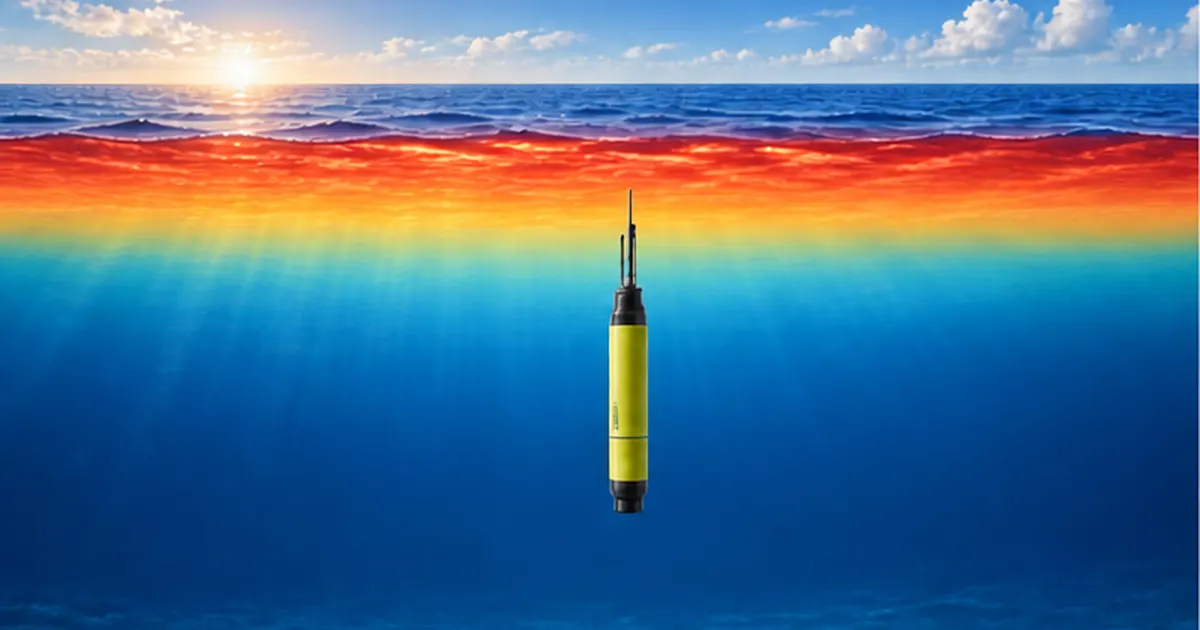
Sea surface temperature (SST) is the water temperature near the ocean surface. But "surface" can mean different depths, and values differ slightly. A water sample from a ship's bucket comes from tens of centimeters to a few meters down, a moored buoy measures about 1 m below the surface, an infrared satellite sees the thin skin of the surface (tens of micrometers), and a microwave satellite sees a layer a few millimeters deep. Each method "sees" a different depth.
Because heat escapes from the sea to the atmosphere, this thin surface skin is known to be about 0.2°C cooler than the water just below (the cool-skin effect). Satellite products are therefore adjusted for the difference between the surface temperature a satellite measures and the in-water temperature measured by buoys.
Why sea surface temperature affects weather, climate and fisheries
The ocean stores vast amounts of the Sun's heat, carries it with currents, and passes it to the atmosphere as water vapor. Evaporation is strong where the sea surface is warm, and typhoons gain energy from warm water. Multi-year climate variations such as El Niño and La Niña are also defined by sea surface temperature patterns in the equatorial Pacific.
Moreover, the distribution of migratory fish such as Pacific saury, Japanese flying squid and salmon depends strongly on water temperature, and coral bleaching occurs when water stays warmer than normal. Sea surface temperature is thus a basic dataset for weather forecasting, climate monitoring, fisheries and ecosystem conservation.
Key point: read SST together with where it was measured
- Infrared sees the thin surface skin, microwave a few millimeters, and buoys and ships measure water below the surface
- Different methods give slightly different values, so correction and standardization are essential for comparison
- Internationally, efforts such as GHRSST are working to merge multiple observations into consistent datasets
What this article covers
Based on public sources, this article explains how satellites (SHIKISAI, SHIZUKU and others) measure sea surface temperature from space, how Argo floats measure below the surface, and the picture of ocean warming that emerges when both are combined.
History of observation: from buckets to satellites
Ship observations and the bucket era
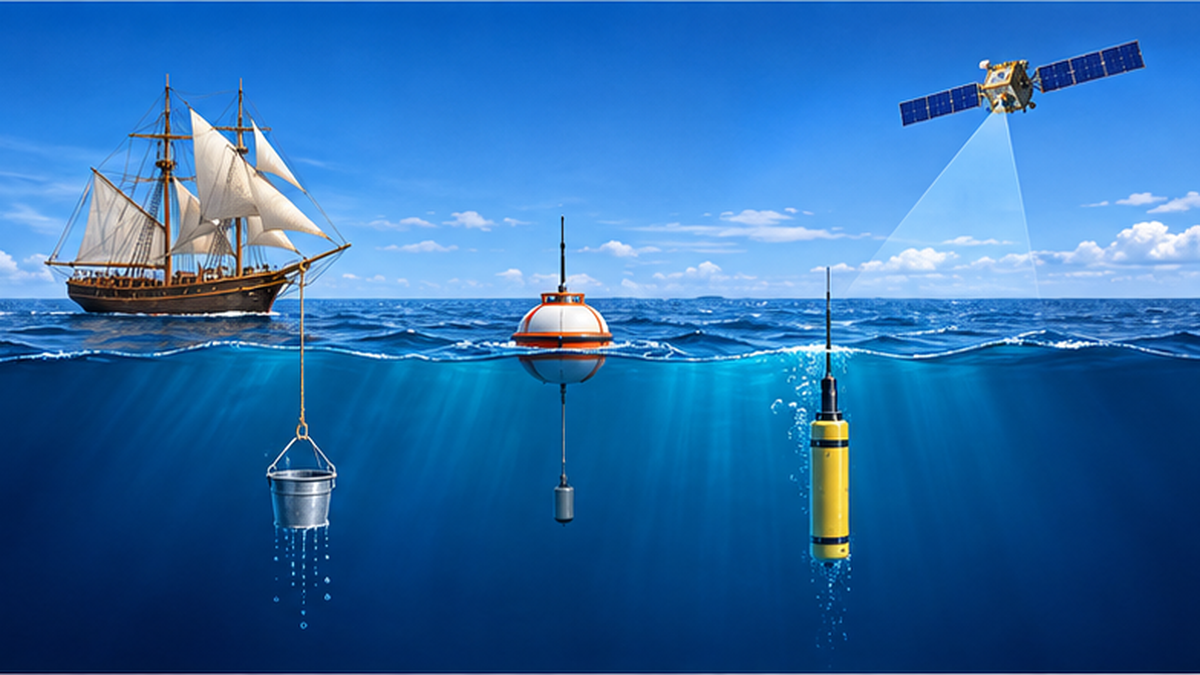
Recording ocean temperature systematically began in the age of sailing ships. Ships drew seawater in buckets, measured it with a thermometer and noted it in their logs. Records accumulated from the 19th to the mid-20th century form the foundation of today's long-term climate data.
However, evaporative cooling varies with the bucket material (wood, canvas, metal) and the time before measurement, and later methods such as measuring at engine cooling-water intakes spread, so changes in method introduced bias. Researchers correct for these differences to build continuous records of more than 100 years.
The arrival of buoys and satellites
In the late 20th century, moored and drifting buoys that automatically measure water temperature were added. Satellites then made it possible to observe the whole globe continuously, including areas with few ships. Satellite sea surface temperature observation was attempted from the 1970s, and practical data have accumulated since the 1980s.
Today the standard is a combination of methods, in which ships, buoys, satellites and Argo floats measuring below the surface each contribute their strengths.
| Method | Approximate depth measured | Strengths | Weaknesses |
|---|---|---|---|
| Ships (bucket / intake) | Surface to a few meters | Long history, direct on-site measurement | Biased toward shipping routes, differences in method |
| Moored / drifting buoys | About 1 m below the surface | High accuracy, continuous observation | Limited number and locations |
| Infrared satellites | Thin surface skin | High spatial resolution, wide coverage | Cannot see through clouds |
| Microwave satellites | A few millimeters below the surface | Can observe through clouds | Coarse resolution; affected by land, rain and strong wind |
| Argo floats | 0–2,000 m depth | 3D structure of temperature and salinity below the surface | Cannot resolve the sea surface itself in detail |
What the history of satellite observation shows
Among Japanese satellites, SHIZUKU (GCOM-W), the Global Change Observation Mission - Water satellite, was launched on May 18, 2012, and SHIKISAI (GCOM-C), the climate change observation satellite, in December 2017. They are the two satellites of JAXA's GCOM program: SHIZUKU targets the water cycle (precipitation, water vapor, sea surface temperature and more), and SHIKISAI targets phenomena related to the carbon cycle and radiation budget (clouds, aerosols, ocean color, vegetation, snow and ice).
Note: GCOM-W and GCOM-C
- GCOM-W "SHIZUKU": carries the microwave radiometer AMSR2 and observes sea surface temperature, water vapor, precipitation and more
- GCOM-C "SHIKISAI": carries the optical and infrared imager SGLI and observes sea surface temperature, ocean color, clouds and more
- Sea surface temperature is a representative product obtained from both satellites
Measuring with infrared: SHIKISAI (SGLI) and geostationary weather satellites
Deriving temperature from the "glow" of the sea in thermal infrared
Every object emits infrared radiation (thermal emission) whose strength depends on temperature. The sea surface is no exception: the warmer the water, the stronger the thermal infrared it emits. By measuring this intensity with a satellite sensor, the sea surface temperature can be calculated back using Planck's law. This is the basic principle of infrared sea surface temperature observation.
However, some infrared radiation is absorbed and re-emitted by atmospheric water vapor, so the water appears colder than it is. Multiple thermal infrared channels at slightly different wavelengths are therefore used, and the atmospheric effect is estimated from the differences between channels and removed (the split-window method).
What does SHIKISAI's SGLI measure?
SGLI (Second-generation Global Imager) on SHIKISAI is an imaging radiometer observing from near-ultraviolet to thermal infrared (380 nm to 12 µm) in 19 channels. According to JAXA, its swath on the ground exceeds 1,000 km, enabling global observation about once every two days at mid-latitudes such as around Japan. Sea surface temperature is one of 28 geophysical products created from SGLI observations.
The greatest strength of infrared observation is fine spatial resolution. Because the sea surface is captured at a scale of several hundred meters to 1 km, it can depict fine temperature patterns such as Kuroshio meanders, cold coastal waters and the spread of river water.
Himawari: temperature as a "movie" every 10 minutes
The Japan Meteorological Agency's geostationary weather satellite Himawari stays fixed about 36,000 km above the equator and observes the same area at high frequency. It is also used in sea surface temperature analysis, and frequent observation is its strength. While polar-orbiting satellites (SHIKISAI and SHIZUKU) scan the surface in strips as they circle the Earth north to south, a geostationary satellite can look at the same place repeatedly, making it suited to capturing daily temperature changes.
Weakness of infrared: clouds
Thermal infrared is blocked by clouds. The sea beneath thick cloud cannot be seen, and the cloud-top temperature is measured instead. Accuracy of infrared sea surface temperature therefore depends on cloud detection (cloud screening). In cloudy areas such as under the Baiu front, in typhoons, and the Sea of Japan side in winter, the days with valid data are limited.
Caution: infrared cannot reach the sea surface through clouds
- Insufficient cloud detection can let in errors that make the water appear colder than it is
- Gaps caused by clouds are filled by compositing several days of data or combining with other observations
Measuring with microwaves: strengths and limits of SHIZUKU (AMSR2)
Microwaves pass through clouds
The sea surface also emits microwaves (a type of radio wave) according to its temperature. This radiation (brightness temperature) is weaker than infrared, but it reaches the satellite with hardly any blocking by cloud droplets. Microwave radiometers can therefore observe sea surface temperature even in areas covered by clouds.
AMSR2 (Advanced Microwave Scanning Radiometer 2) on SHIZUKU observes at multiple microwave frequencies and polarizations. JAXA documents list a swath of 1,450 km and seven frequency bands. Low frequencies (the 6–10 GHz range) play an especially important role in sea surface temperature observation.
Used by the JMA: contributing to sea surface temperature analysis
The Japan Meteorological Agency and JAXA announced that the JMA began using AMSR2 data in its sea surface temperature analysis on May 27, 2013. The satellite data are sent to the JMA in real time and fill gaps in the analysis, drawing on strengths different from those of infrared satellite data.
Weaknesses of microwave observation
- Coarse spatial resolution: tens of kilometers, compared with several hundred meters to 1 km for infrared, so fine temperature structure near the coast is hard to see
- Weak near land and coastlines: radio waves from land contaminate the signal, making coastal data hard to use
- Effects of heavy rain, strong wind and sea ice: JAXA keeps improving the retrieval, for example by introducing a correction method for weak-rain areas
- Low frequencies lose sensitivity in cold water (the colder the sea, the harder it is to see)
Infrared and microwave are truly complementary: infrared sees fine detail but is weak against clouds, while microwave is strong against clouds but coarse. Combining the two opens the way to grasping sea surface temperature "in fine detail, even under clouds."
| Item | Infrared (SHIKISAI/SGLI etc.) | Microwave (SHIZUKU/AMSR2) |
|---|---|---|
| Effect of clouds | Affected (cannot see under clouds) | Almost unaffected |
| Spatial resolution | High (several hundred m to 1 km) | Coarse (tens of km) |
| Coastal areas | Easy to observe | Weak because of land influence |
| Rain and strong wind | Small effect if no clouds | Easily affected |
| Layer measured | Thin surface skin | A few millimeters below the surface |
Making satellite data usable: calibration, merging and international cooperation
Validating satellite data with buoy measurements
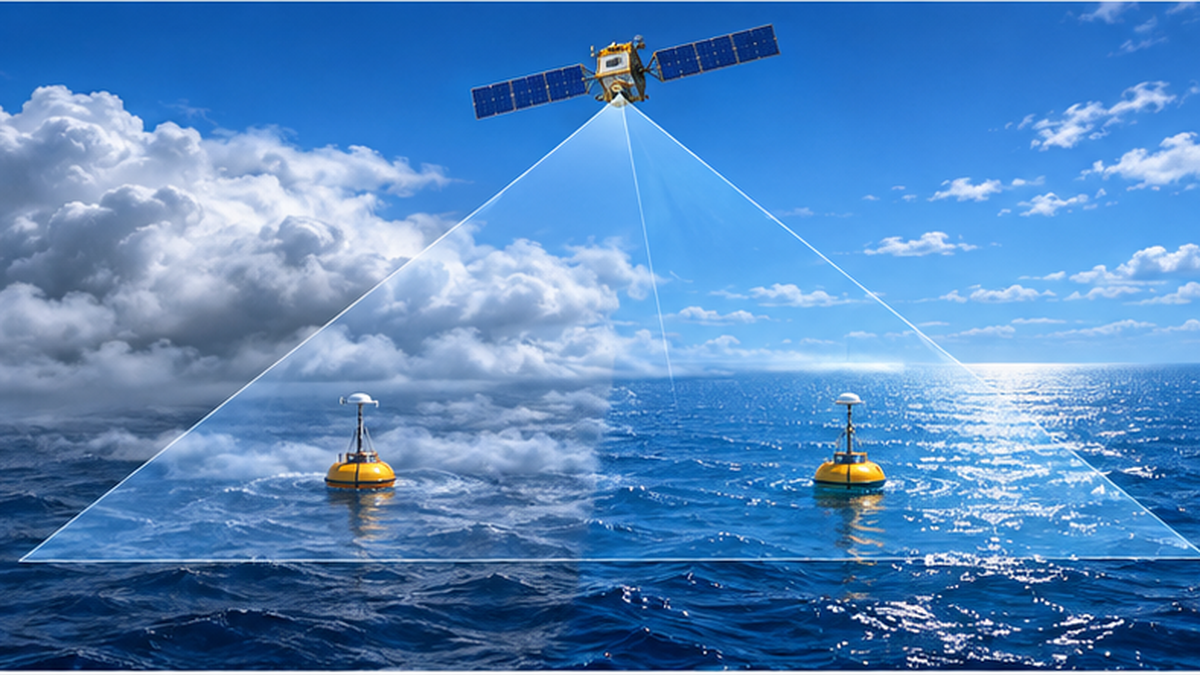
A satellite measures only the strength of electromagnetic waves. The algorithms that convert it to temperature are adjusted and validated against in-situ measurements from ships and buoys. Observations by drifting and moored buoys around the world are indispensable as "ground truth" for estimating satellite errors.
Merging satellites and observations: compositing and objective analysis
A single satellite inevitably has gaps because of clouds and orbit spacing. Infrared, microwave, multiple satellites and in-situ observations are therefore combined statistically to create daily, gap-free maps of sea surface temperature. Organizations such as the Japan Meteorological Agency and the US National Oceanic and Atmospheric Administration (NOAA) each produce and publish analysis data.
For example, NOAA's sea surface temperature dataset (OISST) has run since September 1981 and is widely used in climate monitoring. Such data are used for El Niño monitoring, detecting marine heatwaves and as initial conditions for numerical forecasts.
GHRSST: an international framework for common formats and quality
Sea surface temperature data produced by organizations around the world cannot be compared if formats and definitions differ. GHRSST (Group for High Resolution Sea Surface Temperature), an international cooperation framework, works to unify data formats, quality information and the definition of "at what depth" the temperature applies. JAXA's AMSR2 sea surface temperature products are also provided in GHRSST format.
Term: what is subskin temperature?
- Satellite microwaves see the temperature just below the surface (subskin)
- Infrared sees the temperature of the thinnest surface layer (skin)
- GHRSST defines these separately so they can be handled distinctly
Where to get the data
JAXA observation data can be obtained and viewed through G-Portal (JAXA's Earth observation data provision system) and the EORC (Earth Observation Research Center) site that visualizes Earth observation satellite data. The Japan Meteorological Agency also publishes long-term changes in sea surface temperature around Japan and globally in its "Ocean Health Diagnosis," so anyone can check the latest situation.
Measuring below the surface: Argo floats, the ocean's fixed-point observers
What is the Argo program?
Satellites see only the sea surface. The core of ocean warming is the heat stored beneath the surface. The international Argo program measures that subsurface temperature and salinity worldwide. According to the Argo website, about 4,000 autonomous floats maintained by many countries observe down to 2,000 m about every 10 days.
Argo deployment began in 2000, and by the mid-2000s it had become a network covering nearly the whole globe. JAMSTEC (Japan Agency for Marine-Earth Science and Technology) leads Japan's part of Argo and releases the data free of charge worldwide through the GDAC (Global Data Assembly Centers).
How a float works: an autonomous robot that rises and sinks with oil
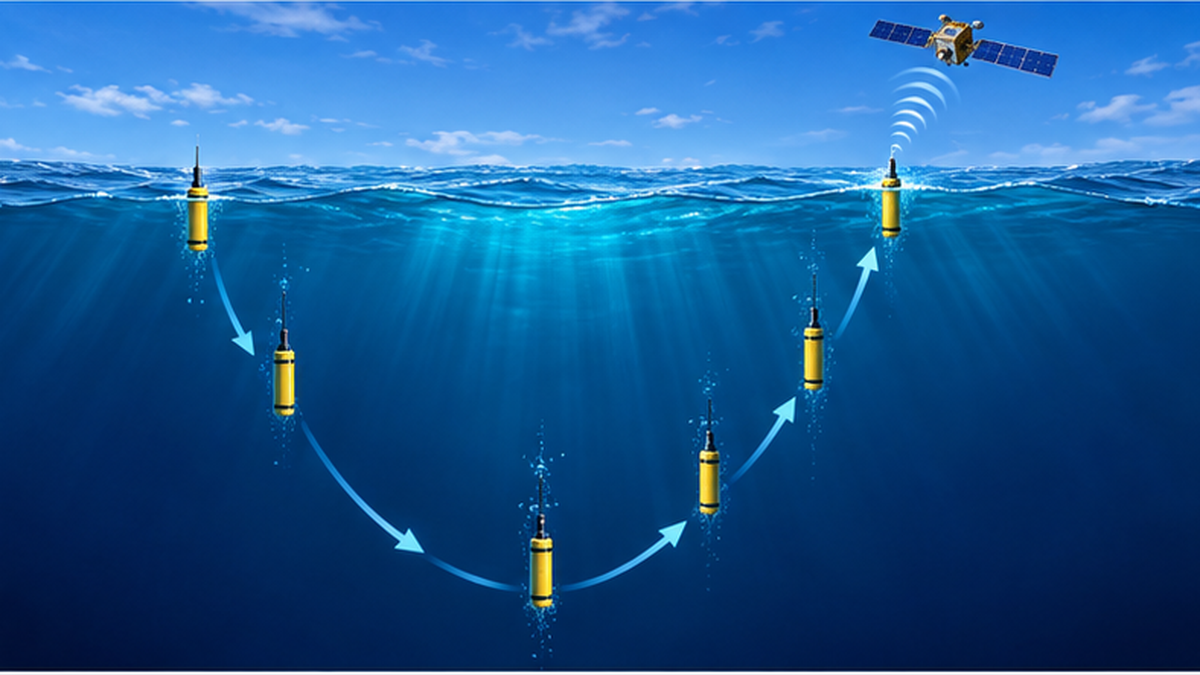
An Argo float is a cylindrical instrument about ten-odd centimeters across and about 2 m long. Inside are temperature, salinity and pressure sensors, a communication unit for sending data, a pump and motor for rising and sinking, and batteries. It changes its volume (and thus buoyancy) by moving oil with the motor and pump between the inside and an external bladder.
- Placed in the sea, the float sinks to about 1,000 m and drifts (parking)
- After about nine days, it sinks further to 2,000 m and then starts to rise
- While rising, it continuously measures temperature, salinity and pressure
- On reaching the surface, it transmits the observations and its position via satellite
- It dives again and begins the next observation cycle (a cycle of about 10 days)
A float repeats this cycle for about three to four years. Floats at the end of their life are not recovered, and new floats are deployed to maintain the network.
Evolving Argo: the deep ocean and BGC
Argo continues to evolve. Countries are deploying "Deep Argo" floats that dive deeper than 2,000 m and "BGC (biogeochemical) Argo" floats that also measure dissolved oxygen, chlorophyll and other biological and chemical variables. The same system is becoming able to track not only temperature but also ocean deoxygenation and changes in phytoplankton.
Satellites and Argo: two sides of one picture
- Satellites: see the sea surface widely and frequently (strong in horizontal coverage)
- Argo: sees the vertical structure beneath the surface (strong in depth-wise heat accumulation)
- Only by combining both can we tell how much heat the ocean has absorbed
What observations show about ocean warming: reading the numbers
About 90% of the Earth's excess heat goes into the ocean
The IPCC Sixth Assessment Report (AR6) Working Group I states that of the energy accumulated in the climate system, ocean heating accounts for about 91%, while land, ice melt and the atmosphere account for about 5%, 3% and 1%, respectively. Most of the heat from global warming is taken up by the ocean, not the atmosphere.
The report also assesses that ocean surface temperature rose on average by 0.88°C (0.68–1.01°C) from 1850–1900 to 2011–2020. This global average is smaller than the rise over land (1.59°C), but because the ocean stores an enormous amount of heat, even a small temperature rise corresponds to a huge amount of energy.
Waters around Japan are warming even faster
According to the Japan Meteorological Agency, the annual mean sea surface temperature around Japan has risen at about 1.3–1.4°C per 100 years (+1.36°C in the latest diagnosis), well above the rate for the global sea surface temperature (+0.63°C per 100 years). The 2024 annual mean sea surface temperature around Japan was 1.44°C above normal, the highest since records began in 1908.
| Indicator | Value | Source |
|---|---|---|
| Share of heat absorbed by the ocean | About 91% | IPCC AR6 WG1 |
| Rise in ocean surface temperature (1850–1900 to 2011–2020) | 0.88°C | IPCC AR6 WG1 Chapter 9 |
| Rate of rise in annual mean SST around Japan | +1.36°C per 100 years | Japan Meteorological Agency |
| Rate of rise in global annual mean SST | +0.63°C per 100 years | Japan Meteorological Agency |
| 2024 annual mean SST anomaly around Japan | +1.44°C (highest since 1908) | Japan Meteorological Agency |
Marine heatwaves and heat accumulation found by satellites and Argo
Continuous satellite observation also helps detect "marine heatwaves," in which a sea area stays abnormally hot for a long time. Argo data have also shown that the temperature rise reaches not only the surface but hundreds to 2,000 m deep. For long-term records of ocean heat content, see our article Record Ocean Heat Content.
For the effects of marine heatwaves on corals and ecosystems, see What Is a Marine Heatwave?; for effects on ocean currents, see How Do Ocean Currents Change as the Sea Warms?.
How the data are used: weather forecasts, fisheries and disaster prevention
Weather forecasts, typhoon prediction and climate monitoring
Sea surface temperature is an important input to numerical forecast models. Typhoons develop more readily over warmer water, so it bears directly on typhoon intensity forecasts. El Niño and La Niña monitoring is also based on sea surface temperature anomalies in the equatorial Pacific, and better forecasts depend on cooperation between satellites and Argo. For how El Niño and La Niña affect fisheries, see How El Niño and La Niña Change Fisheries and Weather.
Fisheries: fishing grounds and ocean condition forecasts
The boundaries of the Kuroshio and Oyashio and the positions of warm and cold eddies show up in satellite sea surface temperature images. The Japan Fisheries Information Service Center and prefectural fisheries experiment stations use satellite and buoy data to produce ocean condition charts and fishing ground forecasts for fishers. Because changing temperatures change fish distribution and seasons, up-to-date sea surface temperature information helps make operations more efficient and saves fuel. See also Fish Disappearing as the Sea Warms for the link between warming and fisheries.
Aquaculture, coral and ecosystem conservation
Seaweed (nori) and oyster aquaculture suffer poor harvests or mass mortality when temperature goes outside the suitable range. Coral bleaching occurs when above-normal temperatures persist, so information on bleaching risk (coral reef bleaching monitoring) is provided from sea surface temperature. Such temperature anomalies can be detected early because of the network of satellite observation.
What you can do: look at the public data
- Check long-term changes in temperature around Japan in the JMA's "Ocean Health Diagnosis"
- See SHIKISAI and SHIZUKU observation images on the JAXA site
- View the positions and tracks of floats worldwide on the Argo website
- Check ocean condition information issued by local fisheries experiment stations
Summary: following ocean heat with two eyes, from space and from within the sea
Sea surface temperature observation has developed from bucket measurements to buoys, satellites and Argo floats. Infrared satellites (SHIKISAI) capture fine distributions, microwave satellites (SHIZUKU) see the sea beneath clouds, and Argo floats cover the vertical structure down to 2,000 m, each compensating for the others' weaknesses.
These observations show that the ocean has stored about 90% of the heat added by global warming and that waters around Japan are warming faster than the global average. Continuing to measure the ocean's "body temperature" from both space and within the sea supports our understanding of climate change and preparedness for fisheries, disaster prevention and ecosystem conservation.
Summary of this article
- Each method of observing sea surface temperature sees a different depth and has different strengths and weaknesses
- Infrared sees fine detail but is weak against clouds; microwave is strong against clouds but coarse
- About 4,000 Argo floats observe down to 2,000 m about every 10 days
- The IPCC assesses that the ocean absorbed about 91% of the heat in the climate system
- Warming around Japan exceeds the global average, and 2024 was the highest on record
References
- JAXA Global Change Observation Mission - Climate (SHIKISAI / GCOM-C) – Sea surface temperature and ocean color observed by SGLI
- JAXA G-Portal AMSR2 Sea Surface Temperature Product – GCOM-W/AMSR2 L3 Sea Surface Temperature
- JMA and JAXA press release: AMSR2 data used in sea surface temperature analysis – Announced September 2013
- JAMSTEC J-ARGO – Japan's Argo program and how floats work
- Argo Program – Official site of the international Argo program
- JMA Special Diagnosis: 2024 annual mean SST around Japan hits record high – Sea surface temperature around Japan
- JMA Ocean Health Diagnosis – Long-term changes in sea surface temperature
- IPCC AR6 WG1 Chapter 9: Ocean, Cryosphere and Sea Level Change – Ocean surface temperature rise of 0.88°C
- IPCC AR6 WG1 Summary for Policymakers – Heat accumulation in the ocean within the climate system
- GHRSST – International cooperation framework for sea surface temperature data
* Listed in order of reliability: government and academic institutions > peer-reviewed papers > specialized organizations > reliable media