⚡ The answer in 30 seconds
- Sea level is measured two ways: tide gauges on land (relative water level) and satellite altimeters in space (height from the Earth's center). They complement each other.
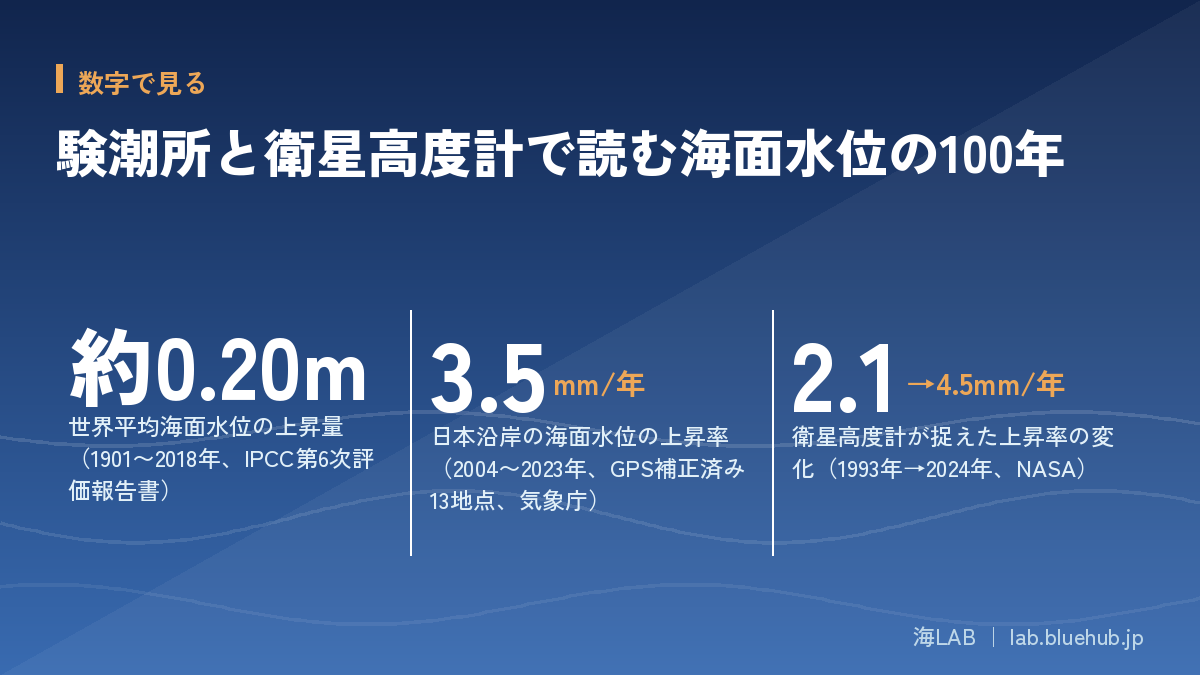
- The IPCC Sixth Assessment Report states that global mean sea level rose 0.20 [0.15–0.25] m in 1901–2018, with rates of 1.3 mm/yr (1901–1971), 1.9 mm/yr (1971–2006) and 3.7 mm/yr (2006–2018).
- According to JMA, no upward trend is seen along Japan's coast over the full 1906–2023 period, but sea level has risen since the late 1980s, at 3.5 mm per year in 2004–2023 (13 GPS-corrected stations).
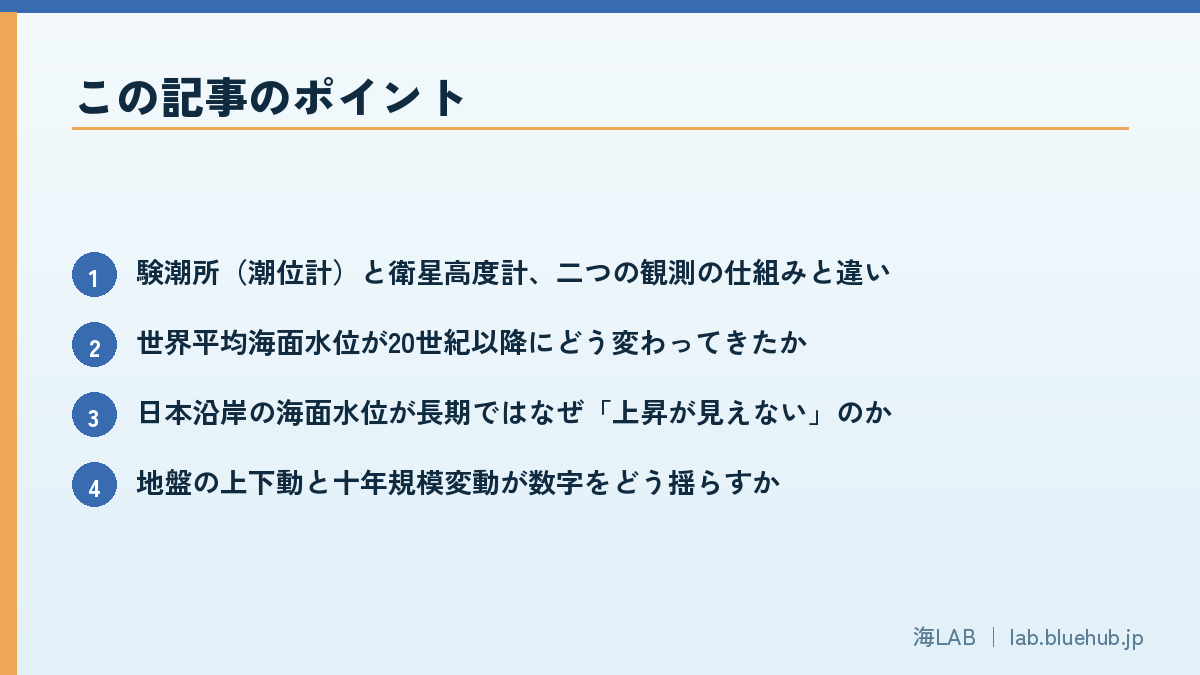
- The quickest way to read the numbers is to check three things: which period, whether land movement is corrected, and whether decadal variability is included.
News that the sea is rising appears almost every year. Yet few people learn what is used to measure it, or how. The IPCC Sixth Assessment Report assesses that global mean sea level rose by 0.20 [0.15–0.25] mbetween 1901 and 2018. Behind that figure lie two accumulated bodies of observation: the long records of tide gauge stations installed in harbors, and satellite altimeters that measure the height of the sea surface from space.
This article explains how tide gauges and satellite altimeters work and how they developed, then reads the long-term changes in sea level along Japan's coast published by the Japan Meteorological Agency (JMA). Over the full 1906–2023 period no upward trend is seen along Japan's coast, yet since the late 1980s sea level has been rising. Understanding this apparently contradictory result is the entry point to reading the data.
Finally, we summarize what to check when you see numbers in the news or in reports. If you pay attention to "how it was measured and over what period," the same sea level story starts to look different.
What you will learn in this article
- How tide gauges and satellite altimeters work, and how they differ
- How global mean sea level has changed since the 20th century
- Why the long-term record along Japan's coast shows "no visible rise"
- How land movement and decadal variability shake the numbers
- How to read public data from JMA, NASA, NOAA and others
- Three points to check when you see sea level numbers in the news
What Is Sea Level Measuring? Two Kinds of "Height"
"Sea level" is not a single thing that is measured. Tides, waves, air pressure, wind, expansion from water temperature, and the vertical movement of land all affect how the "height of the sea" appears. To learn about long-term change, these short-period swings have to be averaged out so that only the slow change remains.
Relative sea level and absolute sea level
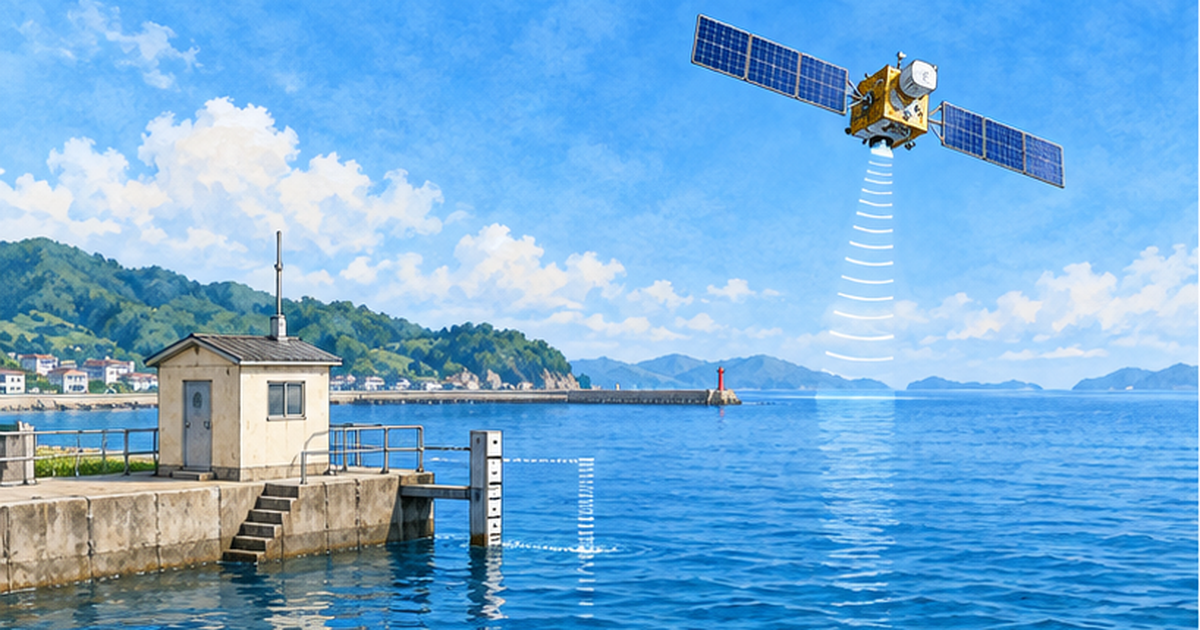
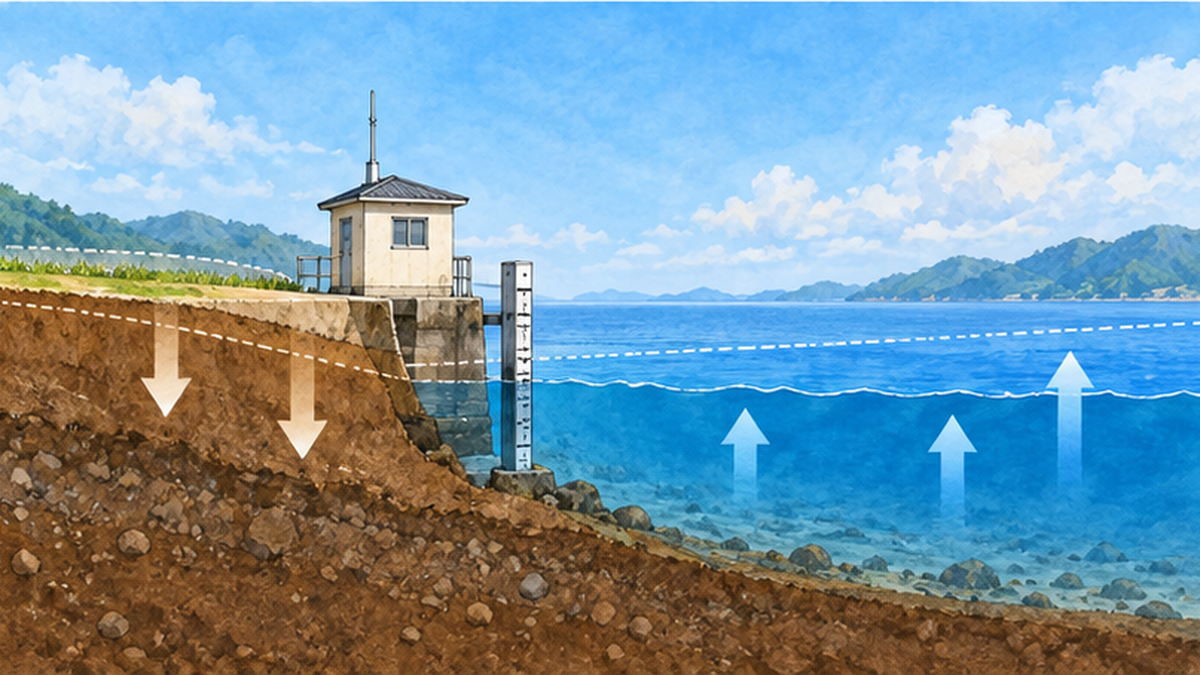
A tide gauge measures the height of the sea relative to a reference fixed on land, that is, relative sea level. If the land itself is sinking, the water level appears to rise even if the sea does not move; if the land is rising, the level appears to fall. A satellite altimeter, on the other hand, measures the height of the sea surface relative to the center of the Earth, which is close to absolute sea level. The two are "different yardsticks for the same sea," and neither is simply right or wrong.
Why do we need two pairs of eyes?
Tide gauges have continuous records of more than 100 years, but they are installed mainly in coastal harbors and cannot directly see wide areas of the open ocean. Satellite altimeters survey the whole globe almost evenly, but observations began only in the 1990s, so their records are shorter than those of tide gauges. Only when tide gauges cover the long time axis and satellites cover the wide spatial range can we describe "how the sea of the whole Earth has moved."
Key points
- Tide gauge = water level relative to land. Long record.
- Satellite altimeter = height from the Earth's center (absolute). Surveys the whole globe.
- Combining the two gives an estimate of global mean sea level.
The History of Tide Gauges: Steady Observation in Harbors
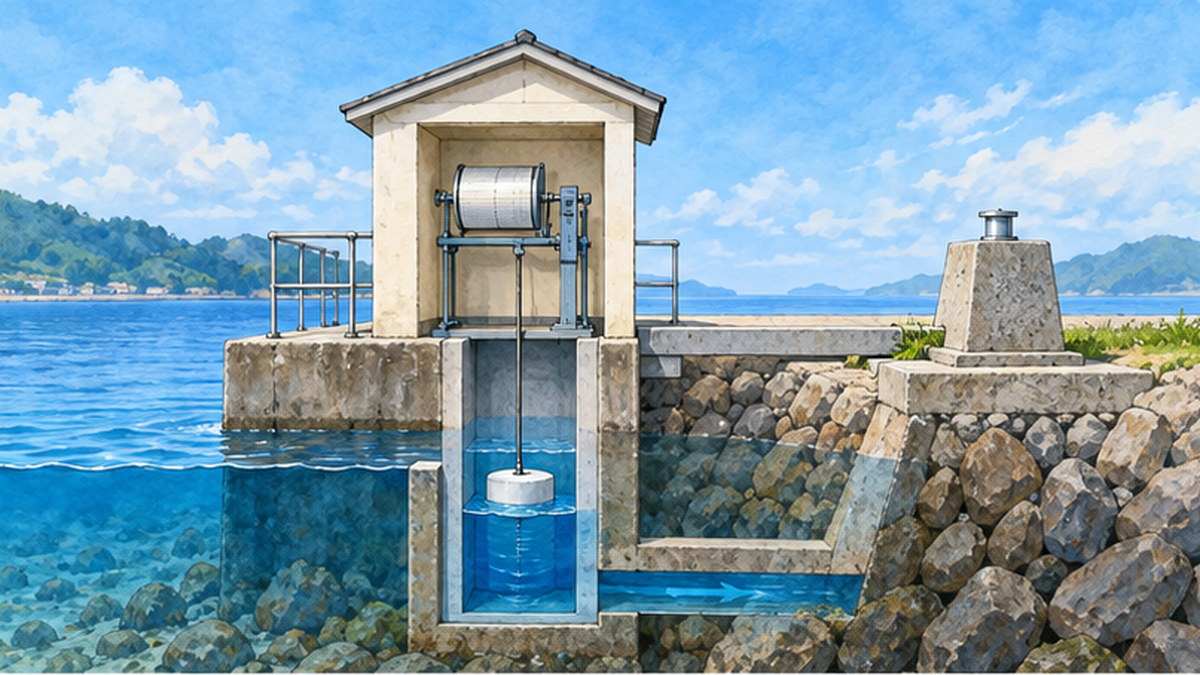
A tide gauge station is an observation facility built in a harbor or bay that continuously records the height of the sea. In the past, systems that recorded the movement of a float on paper were the mainstream; today pressure or radar sensors record automatically and send data over communication lines. Even as methods change, the core value remains "measuring at the same place, against the same reference, without interruption."
The work of keeping the reference fixed
The most important thing for reading long-term water level change is that the observation reference does not drift. Even when a sensor is replaced or equipment changes, the "zero" of the water level must not move. For this reason, tide gauge stations regularly survey the height relationship between the gauge reading and benchmarks on land to confirm it. This unglamorous work is the foundation that joins 100 years of records together.
How the world's records are collected
Records from tide gauge stations in each country are gathered at international data centers and organized so that researchers can use them in a common format. A representative one is the UK's PSMSL (Permanent Service for Mean Sea Level). PSMSL holds monthly and annual mean sea level from around the world, and tide gauge records are also used as evidence in IPCC assessment reports.
- Records are organized as monthly and annual means, which reduces the periodic tidal components through averaging.
- A preserved history of the datum (zero point) supports the reliability of a record.
- Because land movement differs from site to site, comparisons between sites require care.
The Arrival of Satellite Altimetry: Measuring the Sea from Space
The idea of measuring the sea from space became reality in the 1990s. A satellite fires microwave pulses at the sea surface and measures the distance between the satellite and the surface from the time the reflection takes to return. If the height of the satellite's own orbit is determined precisely, the height of the sea surface follows from the difference. This is the basic principle of satellite altimetry.
From TOPEX/Poseidon to Jason, and on to Sentinel-6
According to NASA, high-precision satellite altimetry began with TOPEX/Poseidon (1992–2006) and was carried on by the Jason series. In 2020, Sentinel-6 Michael Freilich, launched through cooperation among Europe, the United States and others, joined and continued the record. By having multiple satellites observe simultaneously for a period, the offsets between instruments are calibrated, producing a consistent time series spanning more than 30 years.
What 30 years have shown
NASA's PO.DAAC explains that, according to the satellite altimetry record, global mean sea level rose by about 11.1 cmover the roughly 30 years from 1993 to 2023. The average rate of rise is about 3.3 mm/yr, and the pace roughly doubled, from about 2.1 mm/yr in 1993 to about 4.5 mm/yr in 2024. In 1993 the record was too short to confirm from satellites alone that the rise was "accelerating," but after 30 years of accumulation the acceleration can be read from the observations.
| Item | Tide gauge | Satellite altimeter |
|---|---|---|
| What it measures | Water level relative to land (relative) | Height from the Earth's center (close to absolute) |
| Length of record | Some sites exceed 100 years | Since the 1990s (about 30 years) |
| Spatial coverage | Points along the coast | Nearly even coverage of the globe |
| Weakness | Land vertical movement is mixed in | Short record; calibration between instruments needed |
How Much Has Global Mean Sea Level Moved? The IPCC Assessment
Combining tide gauge records, satellite records, and information such as changes in glaciers and ice sheets, the IPCC Sixth Assessment Report (2021) summarizes changes in global mean sea level. Its conclusion is that the rise from 1901 to 2018 was 0.20 [0.15–0.25] m. It also states, with high confidence, that the rise accelerated throughout the 20th century.
How the rate of rise accelerated
In the report's summary, the rate of global mean sea level rise is 1.3 [0.6–2.1] mm/yr for 1901–1971, 1.9 [0.8–2.9] mm/yr for 1971–2006, and 3.7 [3.2–4.2] mm/yr for 2006–2018. Listing the numbers makes it clear at a glance that the rate becomes faster as the periods become more recent.
| Period | Global mean rate of rise (mm/yr) |
|---|---|
| 1901–1971 | 1.3 [0.6–2.1] |
| 1971–2006 | 1.9 [0.8–2.9] |
| 2006–2018 | 3.7 [3.2–4.2] |
What is behind the rise: expanding oceans and melting land ice
There are two main reasons the sea level rises. One is thermal expansion, in which warming seawater expands in volume. The other is glaciers and ice sheets melting and sending water from land into the sea. How much heat the ocean stores is covered in detail in our article Record Ocean Heat Content.
How to read the numbers
- The range in brackets shows uncertainty. The wider the range, the less settled the value still is.
- Do not compare numbers from different periods directly. Always check "the average from which year to which year."
Long-Term Change Along Japan's Coast: Why a Century Shows "No Rise"
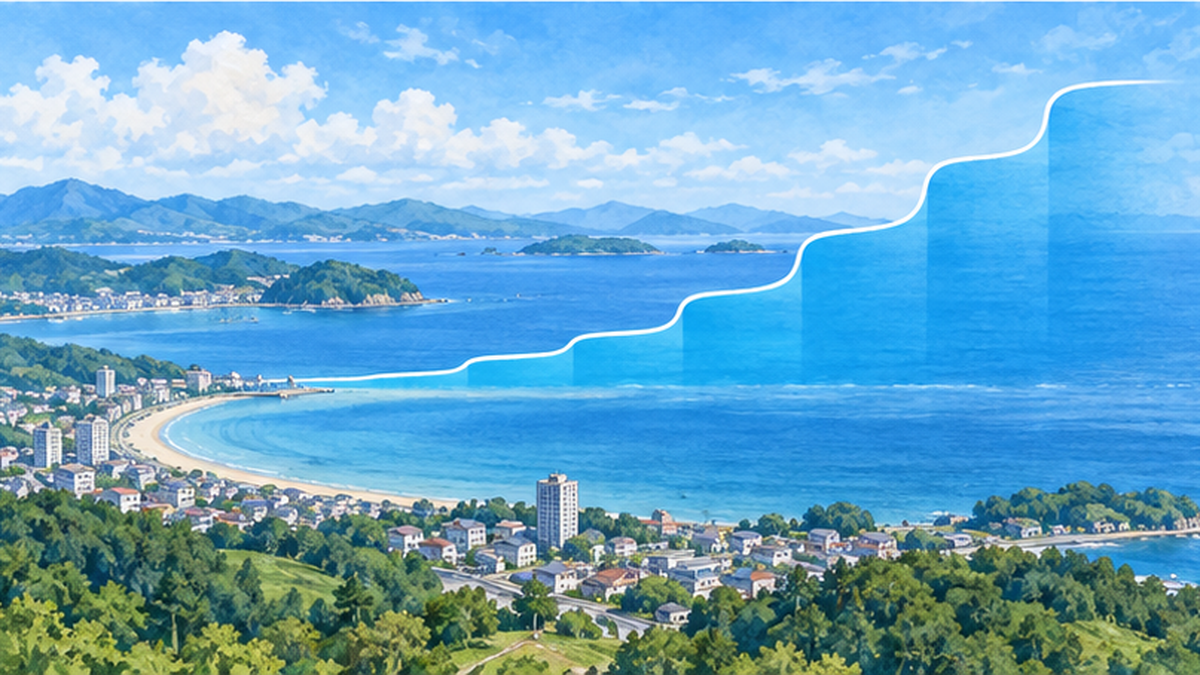
JMA diagnoses and publishes long-term changes in sea level along Japan's coast from tide gauge records. The long-term change since 1906 uses the average of 16 stations in 4 sea areas, while the change since 2004, corrected for vertical land movement, uses the average of 13 stations equipped with GPS. The 2023 diagnosis stated that over the full 1906–2023 period, no upward trend is seen in sea level along Japan's coast.
Fluctuations on a 10–20 year cycle
The same diagnosis shows that sea level along Japan's coast has fluctuations with a cycle of about 10 to 20 years, with highs around 1930, 1950 and 1970. JMA considers that decadal variability from atmospheric phenomena around Japan had a larger influence than the rise due to global warming on the 1906–2023 variations. In other words, the absence of a visible rise in the 100-year average can be read not as "the sea has not risen" but as the natural swings being large enough that the slow upward trend is easily buried.
A rise since the late 1980s
On the other hand, a rising trend has been seen since the late 1980s. JMA interprets this as the acceleration of global mean sea level rise also appearing along Japan's coast. The 2023 value was 72 mm higher than the 1991–2020 normal and the highest since 1906. JMA cautions, however, that the height in a single year is considered to be affected not only by warming but also by decadal atmospheric phenomena.
Avoiding confusion
- "No upward trend over 100 years" and "rising in recent years" do not contradict each other.
- A record in a single year includes both warming and natural variability.
Comparing Japan and the World: Rise Rates for 2004–2023
So how does the recent rate of rise along Japan's coast compare with the global mean? According to JMA's table, the rate for 2004–2023 was 3.7 [2.2–5.2] mm per year for the average of 16 stations in 4 sea areas, and 3.5 [2.5–4.5] mm per year for the average of 13 GPS-corrected stations. The brackets show 90% confidence intervals.
| Period | Japan, 16 stations in 4 areas | Japan, 13 stations (GPS-corrected) | Global mean (IPCC 2021) |
|---|---|---|---|
| 2004–2023 | 3.7 [2.2–5.2] | 3.5 [2.5–4.5] | — |
| 2006–2018 | 2.9 [0.8–5.0] | 3.4 [1.5–5.2] | 3.7 [3.2–4.2] |
Similar, but with a wide range
For 2006–2018, the rate along Japan's coast is similar to the global mean. However, the confidence intervals are wide, and Japan's figures are more uncertain than the global mean. This is thought to be because Japan's coasts are easily affected by currents such as the Kuroshio and by changes in atmospheric pressure patterns, producing large year-to-year scatter. Note also that numbers for different periods cannot simply be compared.
The effects on coasts and the approach to protection are summarized in Will 90% of Japan's Beaches Disappear from Sea Level Rise?.
What Distorts the Numbers: Land Movement and Limits of Observation
The biggest pitfall when reading sea level data is the vertical movement of land. Japan is a country with large ground movement from earthquakes, volcanic activity, groundwater pumping and the like, and the water level at a tide gauge station is recorded as the sum of "change in the sea" and "change in the land."
Correcting for land movement with GPS
JMA therefore uses data corrected for vertical land movement at tide gauge stations equipped with GPS. The idea is to continuously measure the vertical movement of the land next to the station and subtract it, getting closer to the change in the sea itself. The 2023 diagnosis used 13 stations, fewer than the 16 of the long-term series, but with the advantage of removing the influence of land movement.
JMA's page also notes that recent research (Nakano et al., 2023) points out that the influence of vertical land movement may have been larger than that of warming. It is an example of how important land movement is when interpreting long records.
Corrections on the satellite side
Satellite altimetry data also requires corrections. NOAA's satellite altimetry time series applies an inverse barometer correction, which accounts for pressure pushing the sea surface down or up, and uses data within 66 degrees north and south latitude. In addition, because the slow movement of the crust since the ice age (glacial isostatic adjustment) produces an apparent change of about 0.2–0.5 mm/yr in the global mean, its treatment is also stated explicitly.
- Tide gauge: use data corrected for vertical land movement with GPS and similar tools.
- Satellite altimeter: use data with layered corrections for air pressure, orbit, glacial isostatic adjustment and so on.
- In both cases, the method of correction is described in the data documentation.
Looking at the Data Yourself: Where to Find and How to Read Public Information
Sea level data is in fact published in a form anyone can view. JMA publishes figures, explanations and tables on its page on long-term sea level change trends along Japan's coast. NASA and NOAA publish time series graphs of global mean sea level from satellite altimetry, and PSMSL provides tide gauge records from around the world.
Three checks when looking at a graph
- Period: From which year to which year is the data? The slope changes greatly depending on how the start and end points are chosen.
- Correction: Have corrections for vertical land movement and air pressure been applied?
- Variability: Is it a period that includes decadal natural variability, or one in which it has been averaged out?
Practice reading numbers in the news
For example, when you see news that "sea level along Japan's coast this year is the highest ever," what you want to check is whether it is a single-year value or a long-term trend. JMA reports the 2023 value as "the highest since 1906" while also noting the influence of decadal atmospheric phenomena, precisely so that single-year values and trends are read separately.
Try it yourself
- On JMA's sea level page, look at the graph for the sea area where you live.
- Imagine how the slope would change if you changed the starting point of the graph.
- Check which water level your local disaster prevention plan and hazard map assume.
Summary: Two Pairs of Eyes and Three Rules for Reading
To summarize: sea level has been measured by two pairs of eyes, the tide gauge with its long record and the satellite altimeter that surveys the whole globe. Global mean sea level rose about 0.20 m from 1901 to 2018, and the rate accelerated from 1.3 mm/yr to 3.7 mm/yr. Along Japan's coast, no upward trend is seen over the full 1906–2023 period, but sea level has risen since the late 1980s, at 3.5 mm per year in 2004–2023 (13 GPS-corrected stations).
Three rules for reading
- Check the period: the slope changes with the start and end points.
- Check the correction: have the effects of land movement and air pressure been removed?
- Check the variability: separate natural swings from the long-term trend.
How coastal cities prepare for sea level rise is covered in Climate Adaptation for Coastal Cities, and the background to the IPCC assessments in What Is the IPCC Special Report on the Ocean and Cryosphere?. Reading them together reveals the link from observation to action.
Summary of this article
- Tide gauges measure relative sea level; satellite altimeters measure values close to absolute sea level.
- Global mean sea level rose about 0.20 m from 1901 to 2018, and the rise has been faster in recent years.
- Along Japan's coast, no rise is visible over the long term, but sea level has risen since the late 1980s.
- Read numbers by checking three things: period, correction and variability.
References and Sources
- JMA: Long-term Trends in Sea Level along Japan's Coast (2023 diagnosis) – Mean sea level at 16 stations in 4 sea areas and 13 GPS-equipped stations, and rise rates
- IPCC Sixth Assessment Report, Working Group I, Chapter 9: Ocean, Cryosphere and Sea Level Change – Assessment of the amount and rate of global mean sea level rise
- NASA PO.DAAC: The rate of global sea level rise doubled during past three decades – Sea level rise from satellite altimetry, 1993–2023
- NASA Earthdata: The precision behind sea level rise – The lineage of TOPEX/Poseidon, Jason and Sentinel-6 observations
- NOAA STAR Laboratory for Satellite Altimetry: Sea Level Rise – Global mean sea level time series and explanation of corrections
- PSMSL (Permanent Service for Mean Sea Level) – Monthly and annual mean sea level data from tide gauges worldwide
- JMA: Ocean Health Check Report – Explanation of sea level along Japan's coast
* Ordered by reliability: government and academic institutions > peer-reviewed papers > specialist organizations > reliable media