⚡ The answer in 30 seconds
- Wetlands store carbon for a long time in oxygen-poor, waterlogged soils, which is why they draw attention for climate action.
- In Japan, the blue carbon of mangroves (2022) and of seagrass and seaweed beds (2024) has been registered or reported in the national greenhouse gas inventory.
- Japan's seaweed beds are estimated to have halved from about 330,000 ha to 160,000–170,000 ha, and uptake fell about 33%.
- Both protecting and restoring are needed; blue carbon is not a substitute for emission cuts.
When people hear "wetlands" or "tidal flats," many picture waterside homes of wildlife. Those places are also drawing attention as "carbon piggy banks" that help slow global warming.
This article draws on public and research-institute materials to explain, in plain language, how wetlands store carbon and where Japan's blue carbon stands today.
Some figures are estimates, so sources and assumptions are stated.
What you will learn
- Why wetlands store carbon so well
- What blue carbon is and its global context
- Changes in the area and uptake of Japan's seaweed beds
- Differences among tidal flats, mangroves and seaweed beds
- Why measurement is hard, and the challenges
- What we can do
Why are wetlands called "carbon piggy banks"?
"Wetlands" is a collective term for places with waterlogged soil or shallow water. They are very diverse: lakes, river floodplains, peatlands, salt marshes, tidal flats, mangrove forests, and seaweed and seagrass beds. The Global Wetland Outlook, compiled by the Ramsar Convention secretariat, describes wetlands as ecosystems that cover a small share of land yet perform many functions, including supporting biodiversity, purifying water, easing floods and storing carbon.
Carbon storage is especially notable. According to Ramsar Convention materials, peatlands cover only about 3% of land but are said to hold about 30% of the carbon stored on land—roughly twice what the world's forests store, by one explanation. These figures vary with estimation methods, so it is best to read them as approximate ("about," "said to").
The secret of storage: little oxygen
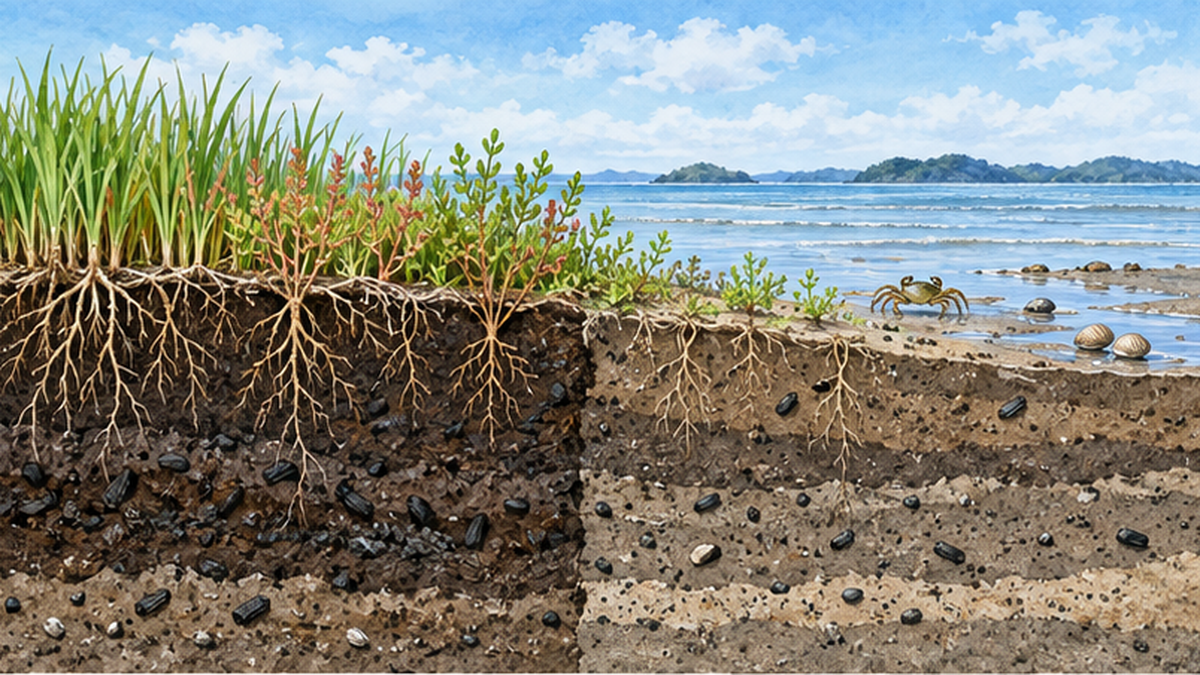
In forests, fallen leaves and dead branches are decomposed by microbes and much of the carbon returns to the air as carbon dioxide (CO₂). In wetlands, the soil is waterlogged and has little oxygen, so decomposition slows greatly. The carbon in dead plants is not broken down and piles up in the mud for hundreds or thousands of years.
- Waterlogged soil: oxygen barely reaches it, so organic matter decomposes slowly
- High plant productivity: wetland plants grow fast and produce large amounts of organic matter every year
- Accumulating sediment: mud carried by tides and rivers piles on top of dead plants, burying the carbon
Marine wetlands are called "blue carbon"
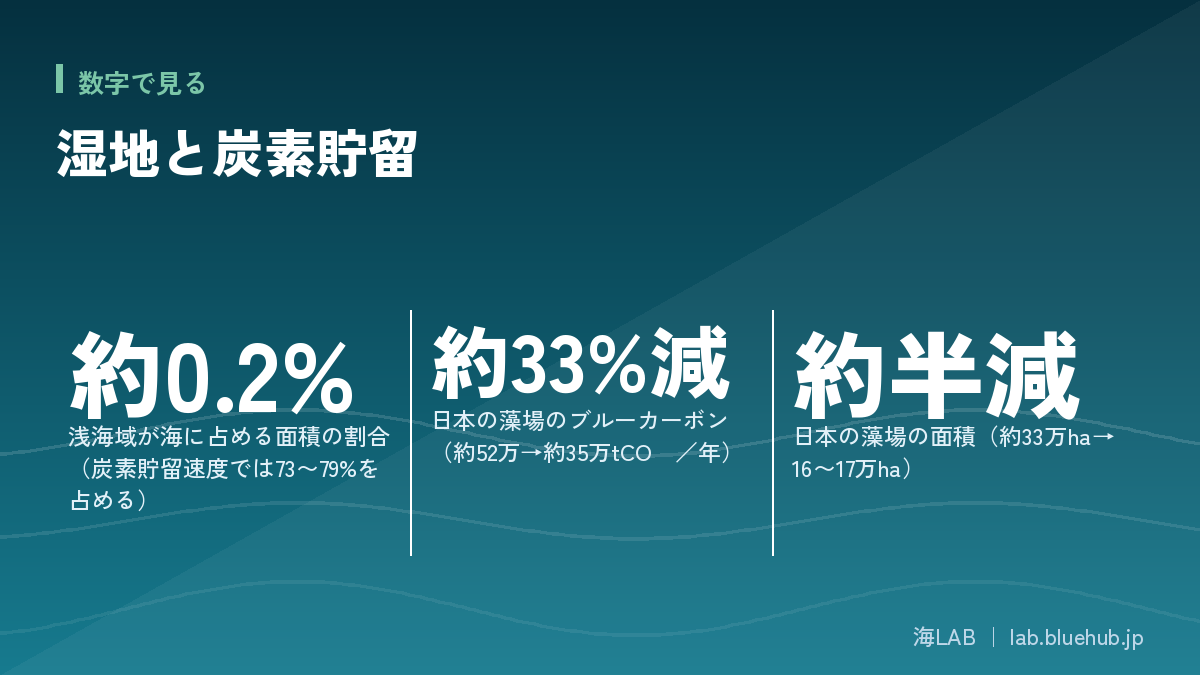
The carbon stored in wetlands in shallow seas—salt marshes, tidal flats, mangrove forests, and seagrass and seaweed beds—is called blue carbon. The term spread worldwide after the 2009 UN Environment Programme (UNEP) report "Blue Carbon." According to materials from the Port and Airport Research Institute and others, shallow waters including salt marshes, mangroves and seaweed beds make up only about 0.2% of the ocean's area, yet account for 73–79% of the ocean's carbon storage rate.
Key points of this section
- Wetlands readily store carbon for long periods in waterlogged, oxygen-poor soil
- Wetlands and seaweed beds in shallow seas are called "blue carbon"
- They cover only about 0.2% of the ocean, but are said to account for over 70% of the ocean's carbon storage rate
The state of the world's wetlands and carbon storage
Worldwide, wetland area keeps shrinking. According to a commentary on the Global Wetland Outlook released in 2025, the world has lost roughly 22% of its wetlands since 1970—about 400 million hectares. Conversion to farmland, urban development, drainage and reclamation are the main causes. Estimates of the decline differ by method, and earlier reports gave larger figures, so treat the numbers as a rough sense of scale.
Characteristics by wetland type
| Type | Main locations | How carbon accumulates |
|---|---|---|
| Peatlands | High-latitude bogs, tropical peat swamp forests | Dead plants do not decompose and build up in deep peat layers for a long time |
| Salt marshes | Tidal grasslands in estuaries and inner bays | Plant remains and transported mud settle and carbon accumulates |
| Mangrove forests | Tropical and subtropical estuaries and coasts | Carbon accumulates in the roots and mud |
| Tidal flats | Sand and mud flats exposed at low tide | Organic matter from microalgae and rivers settles |
| Seagrass and seaweed beds | Shallow coastal seabed | Besides settling on the seabed, drifting seaweed can carry carbon to the deep sea |
When destroyed, they become a "source of carbon"
Carbon stored in wetlands returns to the atmosphere when they are destroyed. Drained peatlands are exposed to oxygen, decompose, and keep emitting large amounts of CO₂. In 2013 the IPCC (Intergovernmental Panel on Climate Change) published the "Wetlands Supplement" so countries can count emissions and removals from such wetlands. By clarifying how to treat mangroves, salt marshes and seagrass beds, it has made it easier for countries to include wetlands in greenhouse gas reporting.
So protecting wetlands has two effects: preventing further emissions and increasing future uptake. The former means not letting stored carbon escape; the latter means storing new carbon through restoration and creation.
Japan's wetlands, shallow-sea ecosystems and carbon
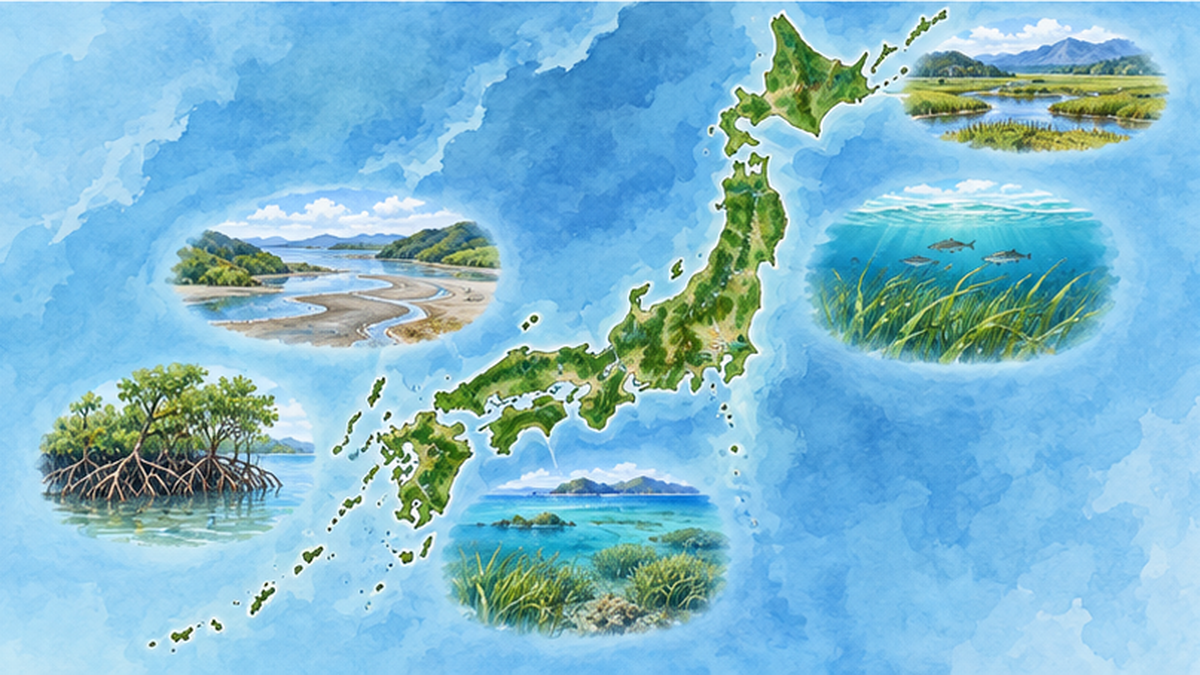
Japan has a long coastline, with shallow-sea ecosystems such as tidal flats, salt marshes, mangroves, and seagrass and seaweed beds scattered around it. It has more than 50 Ramsar sites, and Kushiro Marsh was the first registered in Japan, in 1980 (see our Kushiro Marsh article and Ramsar wetlands article).
Japan's blue carbon has been reported to the UN
In Japan, calculation methods for blue carbon have been developed under a committee led by the Ministry of Land, Infrastructure, Transport and Tourism. According to materials presented by the Port and Airport Research Institute (PARI) in December 2024, mangrove blue carbon was registered in the greenhouse gas inventory in 2022, and seagrass and seaweed beds were also reported in 2024. The materials say this was the world's first report of seagrass and seaweed bed blue carbon in an inventory.
An inventory is the list of a country's greenhouse gas emissions and removals compiled each year. Being listed means blue carbon has begun to be treated as an official national sink.
Seaweed beds have roughly halved in a little over 30 years
In the PARI materials, the area and uptake of seaweed beds nationwide were estimated with a model based on satellite data and conditions such as depth, water temperature and light. The estimate is that seaweed bed area, about 330,000 hectares in 1990, roughly halved to 160,000–170,000 hectares at present (around 2022). Blue carbon uptake also fell about 33%, from about 520,000 t-CO₂/yr in 1990 to about 350,000 t-CO₂/yr now.
| Indicator | 1990 | Present (around 2022) | Change |
|---|---|---|---|
| Area of seaweed beds | About 330,000 ha | About 160,000–170,000 ha | Roughly halved |
| Blue carbon of seaweed beds | About 520,000 t-CO₂/yr | About 350,000 t-CO₂/yr | Down about 33% |
The materials say the decline may reflect not only direct effects such as water temperature changes from the Kuroshio, but also differences in data acquisition methods. These figures carry estimation uncertainty, but the overall trend of decline matches reports of isoyake (barren seaweed beds) around the country (see also our article on isoyake and seaweed beds).
Cautions when reading the numbers
- Seaweed bed area and uptake are estimates from satellite data and models and include uncertainty by year and sea area
- Even in the same materials, regional differences are large: seven sea areas shrank, while the southern Sea of Japan and the Pacific side of Shikoku expanded
Differences among tidal flats, salt marshes, mangroves and seaweed beds
Tidal flats: supporting both wildlife and carbon
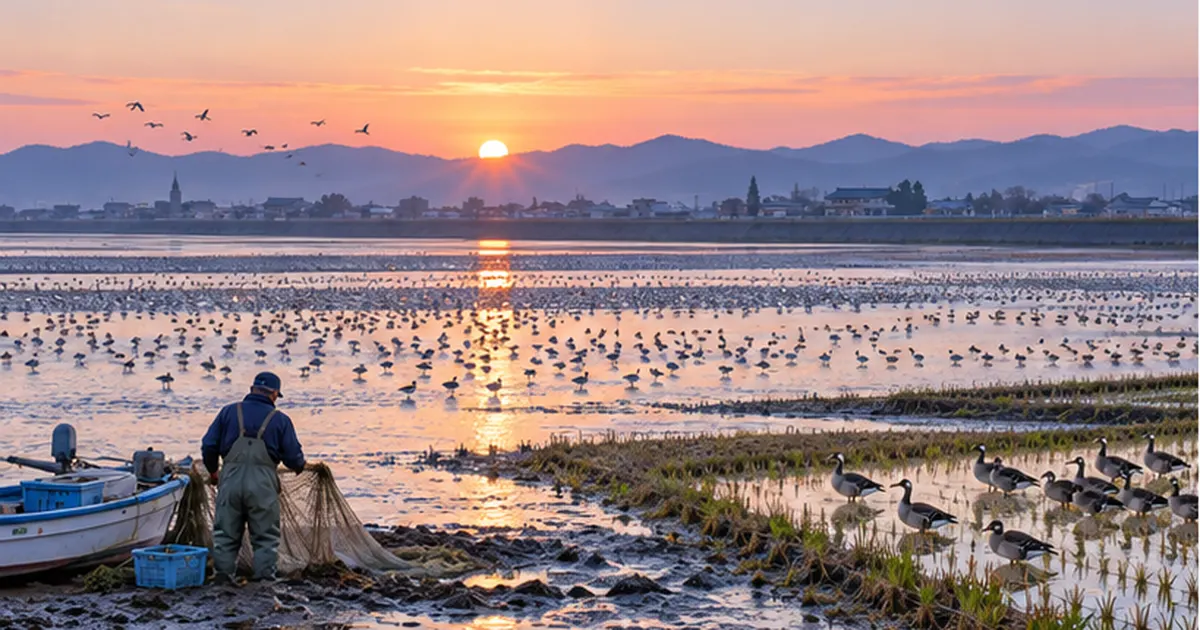
Tidal flats are places where wide sand and mud flats appear at low tide. Bivalves, crabs, polychaete worms and migratory birds live there, and they help purify water. For carbon, organic matter and fine algae brought by rivers mix into the mud and settle. However, tidal flats were heavily lost to postwar reclamation, so conservation and restoration remain challenges (see our articles on tidal flat conservation and reclamation).
Mangrove forests: locking carbon in tropical mud
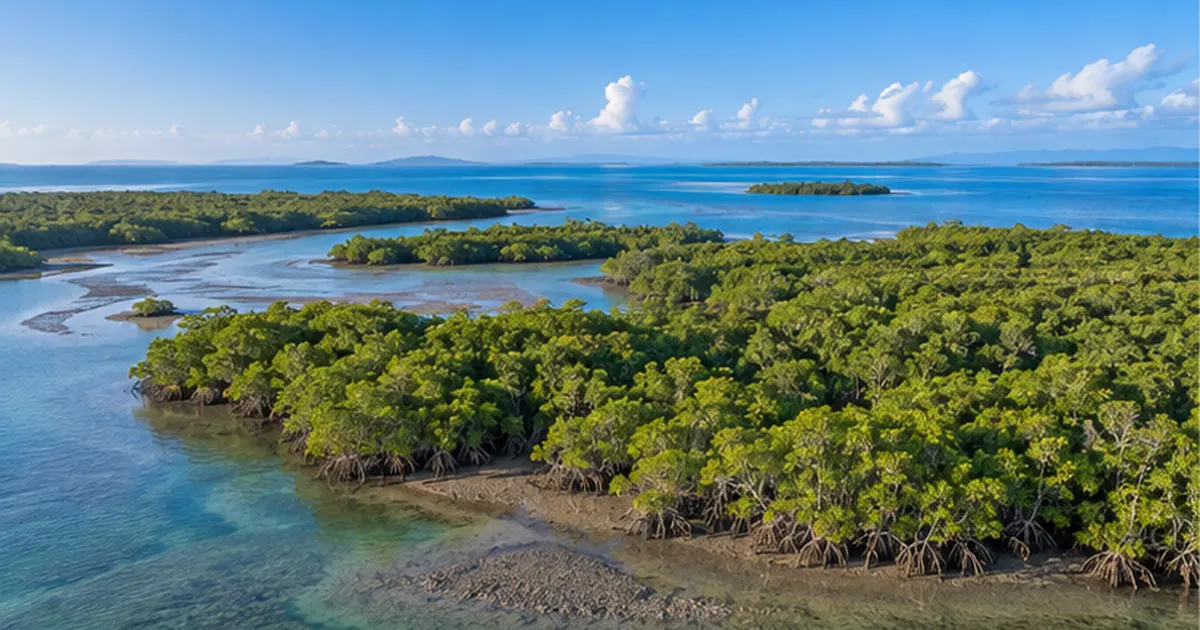
Mangroves are trees that root in brackish mud at tropical and subtropical river mouths. In Japan they grow in places such as Iriomote Island in Okinawa, and as noted, they were registered in the inventory in 2022. Their tangled roots soften waves and shelter young fish (see our article on the role of mangroves).
Seagrass and seaweed beds: wide-ranging and the bulk of uptake
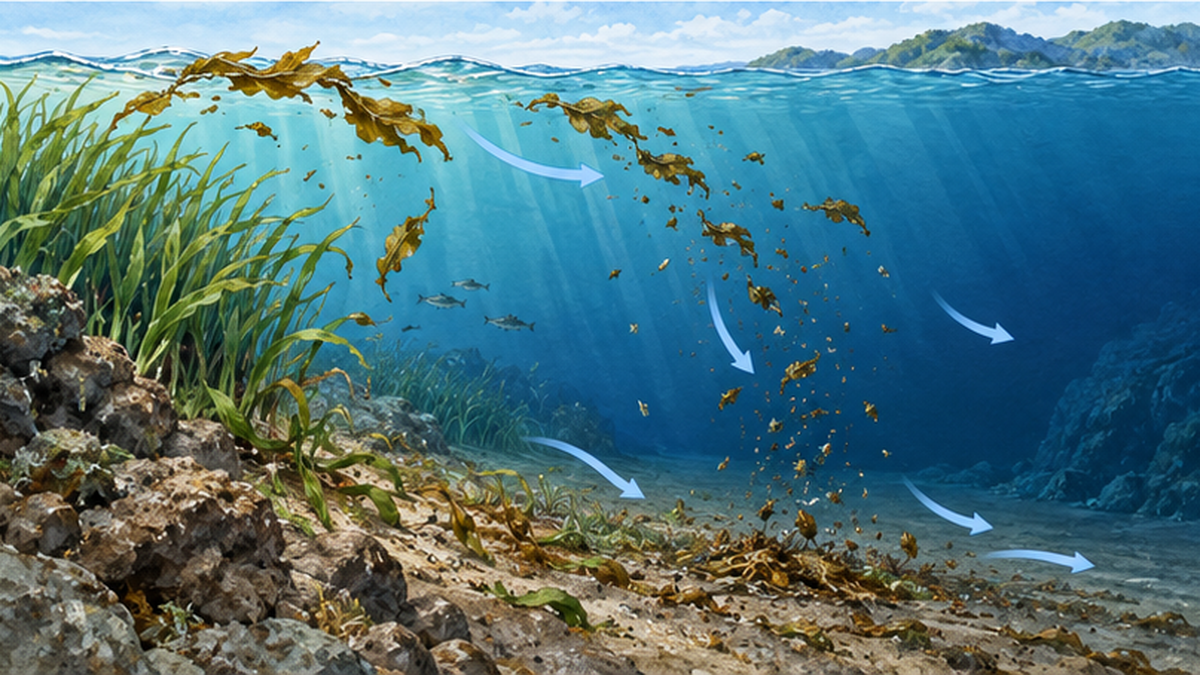
According to the PARI materials, seagrass and seaweed beds, which cover large areas, make up most of the blue carbon of Japan's shallow-sea ecosystems. Seaweed does not bury carbon in soil through roots, but dead seaweed breaks off and becomes drifting seaweed, sinking to the deep sea offshore and being stored for a long time, among several routes. The materials describe four storage processes: (1) settling and storage on the seabed, (2) storage as refractory fragments that settle in coastal areas outside the bed, (3) deep-sea storage, and (4) storage as refractory dissolved organic carbon (RDOC).
- Tidal flats: high biodiversity; organic matter settles in the mud
- Salt marshes: estuarine grasslands where mud and plant remains pile up
- Mangroves: store carbon in roots and mud, and soften storm surges and waves
- Seaweed beds: wide areas; the bulk of Japan's blue carbon
Challenges and perspectives on wetland carbon storage
Uptake is not large, but overlaps with other values
Compared with Japan's total greenhouse gas emissions, the uptake of blue carbon is by no means large. But wetlands and seaweed beds are not only sinks but also fish spawning grounds, water purifiers, storm-surge buffers, and places for tourism and learning. The point is not to measure value by carbon alone, but that multiple values overlap.
Why measurement is hard
- Seaweed beds change quickly with water temperature and grazing, and satellites alone cannot track them (the PARI materials say distribution ideally should be grasped every month to year, whereas it is currently every 5–10 years)
- Where, how much and for how long carbon is stored differs greatly by sea area and ecosystem
- Whether stored carbon truly stays out of the atmosphere for the long term is still being researched
Climate change itself is a threat
Rising sea temperatures and marine heatwaves speed the decline of seaweed beds. As beds shrink, uptake falls and the ability to ease global warming weakens, a vicious circle that is a concern (see also our marine heatwave article).
"More wetlands will not solve global warming right away"
- Blue carbon is not a substitute for emission cuts; it is one measure to pursue alongside them
- Uptake is small, and restoration and creation take time
Blue carbon efforts in Japan
Government and research institutes: calculating and visualizing
The Ministry of Land, Infrastructure, Transport and Tourism, the Fisheries Agency, the Ministry of the Environment and research institutes are developing methods to survey seaweed beds and tidal flats and to calculate uptake. The PARI materials say an archive system for automatic estimation is being considered so that seaweed bed blue carbon can be calculated continuously.
Restoring, creating and conserving seaweed beds
Fishers, local governments and citizen groups across Japan are working to restore seaweed beds by removing grazers such as sea urchins, placing mother seaweed, and sowing and transplanting eelgrass. Some ports incorporate features that let seaweed grow on seawalls and breakwaters (see our article on eelgrass bed restoration).
J-Blue Credits: turning uptake into value
The "J-Blue Credit" scheme certifies blue carbon efforts as credits according to their CO₂ uptake so they can be traded. It is drawing attention as a way to generate funding for restoration (see our article on the J-Blue Credit market).
| Actor | Main role |
|---|---|
| Government and research institutes | Distribution surveys, uptake calculation, inventory reporting |
| Fishers and local governments | Removing grazers; conserving and restoring seaweed beds and tidal flats |
| Companies and citizens | Buying credits; joining cleanups and surveys |
What we can do
Wetlands and seaweed beds may seem far away, but you can encounter them in nearby rivers, the sea and even park ponds. Here are three ways to act.
Learn and visit
- Join an observation event at a nearby tidal flat or wetland
- Visit Ramsar sites or nature parks and observe wildlife and the environment
- Take an interest in blue carbon and J-Blue Credits
Protect and get involved
- Volunteer for beach cleanups or eelgrass bed restoration
- Cooperate with local wetland and tidal flat conservation and citizen science surveys
- Support seaweed bed restoration by fishers and local governments
Rethink everyday choices
A life that does not pollute water and soil, and food and consumption with less waste, ultimately protect rivers and seas. Reducing emissions themselves, such as by reviewing energy use, is also essential.
Three things you can do today
- Look up your local wetland, tidal flat or coast and visit once
- Find activities you can join, such as cleanups or observation events
- Tell others that blue carbon is a measure "alongside emission cuts"
Summary: small wetlands support climate and daily life
Wetlands are small in area, but they are climate-critical ecosystems that hold carbon for long periods in oxygen-poor waterside environments. In Japan too, blue carbon of mangroves (2022) and of seagrass and seaweed beds (2024) has begun to be reported to the UN in the inventory. Meanwhile, seaweed beds are estimated to have halved from about 330,000 ha to 160,000–170,000 ha, and uptake has fallen about 33%. Both protecting and restoring are needed.
For related topics, see our article on blue carbon ecosystems and our article on peatlands and carbon, which covers wetlands on land.
Key points of this article
- Wetlands store carbon for long periods in oxygen-poor soil
- Japan's seaweed beds are estimated to have fallen from about 330,000 ha in 1990 to 160,000–170,000 ha, and uptake by about 33%
- Mangroves (2022) and seagrass and seaweed beds (2024) are registered or reported in the national inventory
- Conserving and restoring sinks is a climate measure alongside emission cuts
References
- Port and Airport Research Institute et al., "Estimating the distribution and CO₂ uptake of seagrass and seaweed beds nationwide" (Dec. 2024) – Estimates of seaweed bed area and blue carbon, and inventory reporting
- UNEP, "Blue Carbon" (2009) – The report that popularized the concept of blue carbon
- Ramsar Convention, Global Wetland Outlook – State and value of the world's wetlands
- IPCC 2013 Wetlands Supplement – Guidance on calculating GHG emissions and removals from wetlands
- Ministry of Land, Infrastructure, Transport and Tourism, Ports and Harbours Bureau – Blue carbon initiatives
- Ministry of the Environment, Ramsar Convention – Japan's registered wetlands
- Port and Airport Research Institute (PARI) – Blue carbon research
- Fisheries Agency – Conservation of seaweed beds and tidal flats
* Ordered by reliability: government and academic institutions > peer-reviewed papers > specialist bodies > reliable media