⚡ In short
A single photo taken on your phone can become data that shapes national biodiversity policy. This article maps out citizen science in Japan — Monitoring Sites 1000, the Ikimono Log, the National Sandy Beach Movement, the Biome app — and shows, with concrete numbers, how the records people submit are actually used.
A small crab spotted on a walk. A shell your child picked up on the beach. An unfamiliar bird on the balcony. Simply recording that sighting with a single photo and sharing it turns it into data that supports national biodiversity policy — and that system is already running all across Japan. It is called citizen science.
Researchers alone cannot cover the full length of the Japanese archipelago, which stretches more than 3,000 km, or its roughly 35,000 km of coastline. Keeping that up for 20 or 30 years is closer to impossible. But when the people who live there record what they saw, where and when, the result is data that is both broad and long-running — something no specialist could ever assemble alone. Monitoring Sites 1000, run by Japan's Ministry of the Environment since FY2003, is exactly that: about 1,000 survey sites nationwide, watched over for two decades by researchers, NPOs, and citizen surveyors.
This article starts with the basics of what citizen science is, then walks through the major projects actually running in Japan, how smartphones and AI changed the shape of participation, the surveys unique to the coast, and — most importantly — who uses the resulting data and how, all grounded in verifiable figures and primary sources. At the end, you will find concrete ways to get started today.
What you will learn from this article
- How citizen science turns a casual sighting into genuine scientific data, not just a personal note
- The three pillars of Japan's system: Monitoring Sites 1000, the Ikimono Log, and the National Bird Breeding Distribution Survey
- How smartphone apps and AI image recognition lowered the barrier to taking part
- Concrete coastal projects you can join — sandy beaches, sea turtles, coral reefs, and marine debris — with their results
- How the collected data feeds Red List assessments, the National Biodiversity Strategy, and the 30by30 target
- The weaknesses of citizen science data (spatial bias, misidentification) and how researchers correct for them
What Citizen Science Is — How a Sighting Becomes Science
Citizen science is participatory research carried out by ordinary people working together with professional scientists. Despite the word "science," no degree or certification is required to take part. All you need is to observe according to an agreed method, record accurately, and share what you found.
What matters is that citizen science is not an educational program or a one-off nature event. Citizen science data is collected on the premise that it will end up in research papers and government reports. That is precisely why survey protocols are defined, record formats are standardised, and quality-control steps are built in. You can enjoy taking part, yet what comes out is genuine scientific data — that is the appeal.
The Breadth and Duration Specialists Cannot Cover
To detect ecosystem change, you have to observe a wide area, over a long period, using the same method. If cherry blossoms bloom five days earlier than usual one year, a single year of data cannot tell you whether that is chance or warming. Only decades of records reveal the trend.
Yet this "wide and long" work is exactly the part that attracts the least research funding. It produces no spectacular discoveries; it means walking the same route every year and recording the same things. Citizen science grew up to fill precisely this gap. Someone who lives locally can visit that spot every year. For a hobbyist birdwatcher, keeping records is itself the pleasure. It continues because it is carried by people who have a reason to keep going.
Three Modes of Citizen Science — How Deeply You Want to Be Involved
Citizen science covers a wide range of involvement. Sorting it into roughly three modes makes it easier to find the entry point that suits you.
| Mode | Role of participants | Examples |
|---|---|---|
| Contributory (data collection) | Collect and submit data using a defined method | Posting wildlife photos via an app; filling in a beach debris survey card |
| Collaborative (through analysis) | Collect data and also take part in tallying and interpreting it | The satoyama survey of Monitoring Sites 1000; a local observation group compiling its own annual report |
| Co-created (from the design stage) | Involved from the framing of the question and the design of the survey | Residents investigating a local river or coastal problem themselves and proposing measures to the authorities |
For a first step, the contributory mode is the easiest. Even a single photo becomes one record that stays in the database and may well be used in someone's research. For background on how rich Japan's wildlife actually is, why Japan's seas rank among the most biodiverse in the world is worth reading alongside this — it explains why so many eyes are needed.
Three conditions that make citizen science work
- A defined method: when, where, and how to record is clear, so anyone produces data in the same format
- A place for the data to land: a system (database) exists to store and publish the records collected
- Results come back: participants are told how their records were used, which is what keeps them going
The Three Pillars Supporting Citizen Science in Japan
Japan has built several foundations that receive citizen observations and turn them into scientific data. Here are the three central ones.
Monitoring Sites 1000 — Twenty Years of Fixed-Point Observation at About 1,000 Sites
Monitoring Sites 1000 (formally, the Monitoring Program for Important Ecosystems), run by the Ministry of the Environment since FY2003, is the backbone of citizen science in Japan. It places about 1,000 survey sites across representative ecosystems — alpine zones, forests and grasslands, satoyama rural landscapes, inland waters (lakes and wetlands), coastal areas (rocky shores, tidal flats, eelgrass and seaweed beds, coral reefs), and small islands — and observes them by the same method every year.
What makes the programme possible is a wide range of participants: not only researchers but NPOs and citizen surveyors. The 4th-term summary report, released in October 2024, drew on 20 years of data to show clear changes in Japan's nature: declines in familiar birds such as the Eurasian tree sparrow and the Eurasian skylark, declines in shorebirds and gulls, a year-on-year rise in sightings of sika deer, and the spreading range of invasive birds such as the Chinese hwamei and the red-billed leiothrix.
The satoyama survey shows the fruits of citizen participation in especially clear numbers. Over the 18 years from FY2005 to FY2022, 325 sites yielded 4,382 species and roughly 2.98 million records, revealing sharp declines in butterflies and birds compounded by the effects of climate change. These records exist only because people in local observation groups and NPOs walked the same routes year after year.
Visit the official siteMonitoring Sites 1000 (Biodiversity Center, Ministry of the Environment, Japan)Ecosystem monitoring at about 1,000 sites nationwide, running for more than 20 years. Site lists, reports, and participating organisations are published here.🔗 biodic.go.jp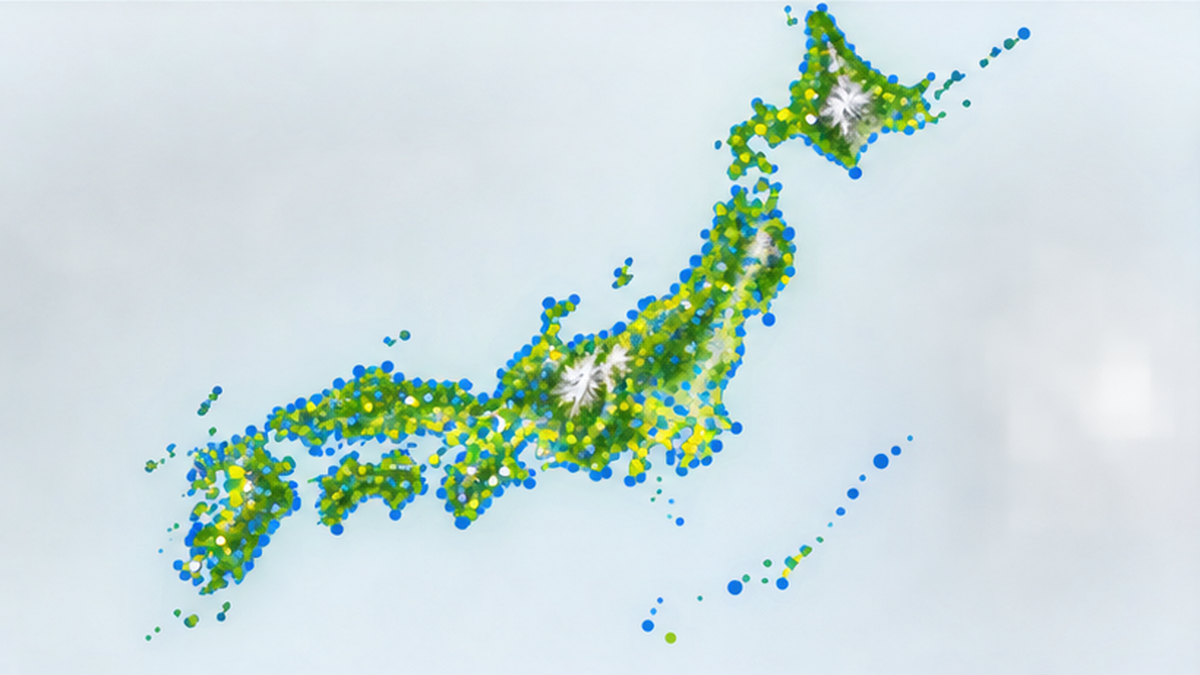
The Ikimono Log — Gathering Scattered Records in One Place
Even when citizens keep records, those records help no one if they stay in a notebook or on a personal computer. That is why the Biodiversity Center of the Ministry of the Environment launched the "Ikimono Log" in October 2013. It consolidates wildlife information held by national agencies, local governments, specialists, and private individuals into a single system, then shares and serves it back out.
The Ikimono Log holds national survey data such as the National Survey on the Natural Environment and Monitoring Sites 1000, while registered users can also submit their own observation records and join open surveys. In other words, official government data and citizen observations sit side by side by design. This is what serves as the receiving platform for citizen science in Japan.
Try taking partIkimono Log (Biodiversity Center, Ministry of the Environment, Japan)A system that collects and serves wildlife information. Anyone can search and browse it; registered users can submit observations and join participatory surveys.🔗 ikilog.biodic.go.jpThe National Bird Breeding Distribution Survey — A Map of Japan's Birds Drawn by 2,106 People
The clearest numerical demonstration of the scale of citizen participation is the National Bird Breeding Distribution Survey (2016-2021), jointly run by the Biodiversity Center of the Ministry of the Environment and five organisations: the Bird Research NPO, the Wild Bird Society of Japan, the Nature Conservation Society of Japan, the Japanese Bird Banding Association, and the Yamashina Institute for Ornithology.
The survey drew 2,106 volunteers and field surveys were carried out at 2,344 locations nationwide. Japan was divided into meshes of roughly 20 km square, with about two survey routes placed in each mesh. Alongside the field surveys, literature records and birdwatching observations were gathered, and a distribution map was produced with breeding ranks colour-coded by mesh. One person can only walk one route — but when 2,000 people walk, you get a map of the birds of the entire archipelago. It is the clearest expression of what citizen science can do.
| Project | Started | Scale and results |
|---|---|---|
| Monitoring Sites 1000 | FY2003 | About 1,000 sites nationwide / 20 years analysed in the 4th-term summary (published October 2024) |
| Same, satoyama survey | FY2005 | 325 sites, 4,382 species, about 2.98 million records (FY2005-2022) |
| Ikimono Log | October 2013 | Consolidates and serves wildlife information from government, local authorities, specialists, and individuals |
| National Bird Breeding Distribution Survey | 2016 | 2,106 volunteers at 2,344 locations nationwide (2016-2021) |
How Smartphones Changed Participation — One Photo Becomes Data
Taking part in citizen science used to require enough knowledge to identify species from a field guide and the habit of writing in a notebook. The barrier was not low. What brought it down all at once was the combination of the smartphone, GPS, and AI image recognition.
Just Take the Photo and You Have When, Where, and What
A wildlife record needs four things at minimum: when (date and time), where (location), what (species), and who (the recorder). Of these, the time and place are embedded automatically in the photo data the moment you shoot with a smartphone. The remaining "what" is now suggested by AI image recognition. In effect, all a participant has to do is take the picture.
This is not merely a matter of convenience. When the number of participants grows by orders of magnitude, the volume and geographic coverage of the data change fundamentally. Records that once amounted to a few dozen from a handful of observation events a year now arrive by the thousands each day from everyday walks. The very nature of citizen science shifted.
Biome — A Wildlife Collection App Born in Japan
Japan's flagship example is Biome, a wildlife collection app developed by BIOME Inc., a start-up spun out of Kyoto University. Seven years after its official launch in April 2019, it had reached 1.25 million cumulative downloads and more than 10 million cumulative posts (as of April 2026).
Biome's distinguishing feature is AI identification that instantly suggests candidate species from a database of about 100,000 species, using the location, the season, and the shape captured in the image. Even without knowing how to use a field guide, you take a photo and it tells you what the organism most likely is. It is designed so your collection grows like a game, and motivating people through the fun of collecting rather than the chore of looking things up is what drives its high retention. The observation data gathered is used as baseline information on the spread of invasive species and the distribution of biodiversity, and feeds into municipal urban planning and environmental education.
See the appBIOME Inc. (the Biome wildlife collection app)A Kyoto University start-up. It provides a wildlife recording app with AI species identification and uses the accumulated data to visualise biodiversity.🔗 biome.co.jp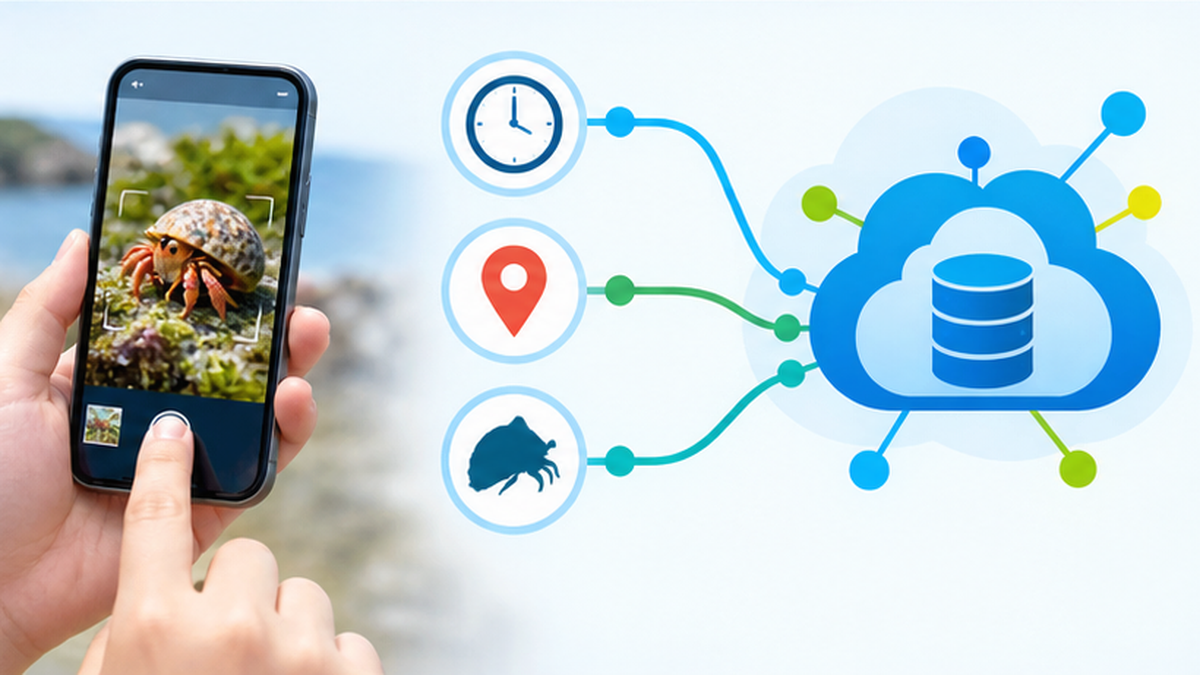
iNaturalist — How Global Observations Accelerate Research
Look worldwide and the same mechanism is running at a far larger scale. iNaturalist, the international wildlife observation platform, had accumulated more than 200 million observation records as of September 2024, with roughly 3.3 million participants.
What deserves attention is how much of that is actually used in research. According to an analysis published in the peer-reviewed journal BioScience in 2025, the number of papers using iNaturalist data grew more than tenfold over five years, reaching 1,410 in 2022 alone — an average of about four a day. The work spans 128 countries and 638 families, with species distribution modelling as the single largest use.
Its presence in GBIF (the Global Biodiversity Information Facility), which aggregates the world's biodiversity data, is also substantial: as of 2022, iNaturalist-derived records made up 6.3% of GBIF as a whole. Exclude the vast volume of bird records and the figure rises to 37.2%. By taxon it reaches 74.0% for reptiles, 63.3% for arachnids, 55.1% for amphibians, and 54.9% for gastropods — showing that the thinner the professional survey coverage, the more citizen observations carry the field.
Citizen science works hardest where specialists are scarce
Taxa such as birds, which have long had dedicated observer communities, already have abundant data. But for groups with few specialists — spiders, snails, amphibians and reptiles — citizen observations can account for more than half of the world's records. There is no need to find something rare; records of the plain, overlooked organisms are often the most valuable of all.
Citizen Science at Sea and on the Coast — Beaches, Sea Turtles, Coral Reefs, and Marine Debris
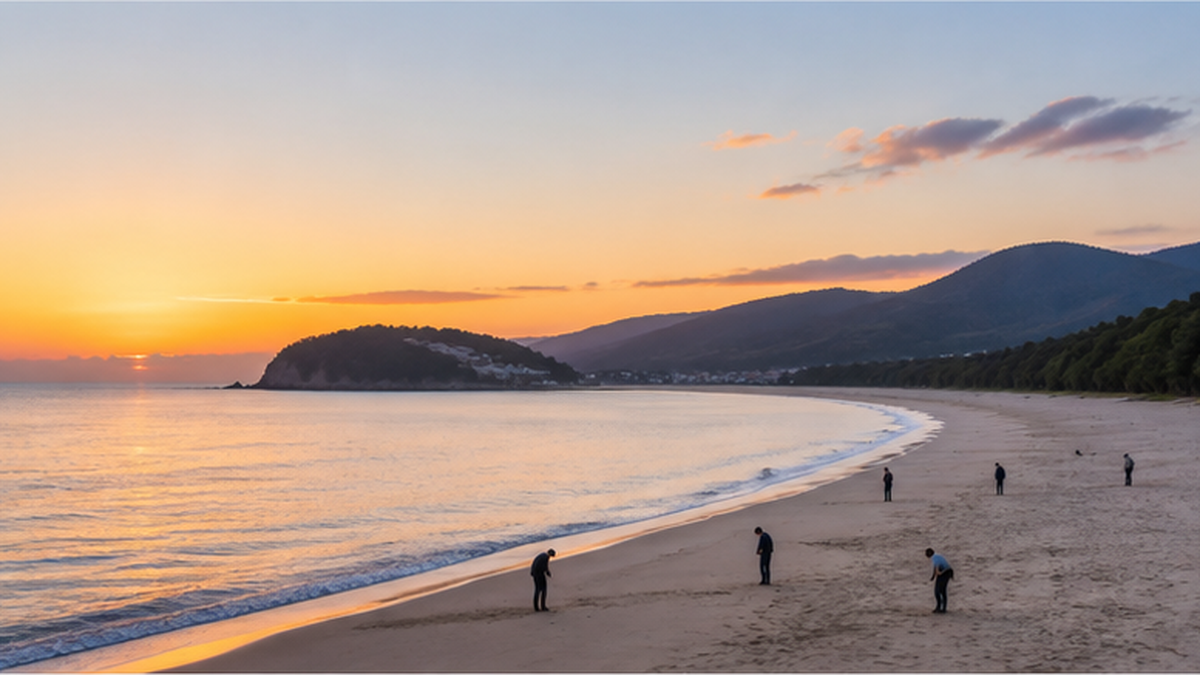
The coast is where citizen science comes into its own. The shoreline is long, much of it can only be observed at low tide, and anyone can walk it. Covering all of it is impossible for researchers, but if local people walk it each season, the records reliably accumulate.
Beaches — the National Sandy Beach Movement and Its 1.7 Million Participants
The National Sandy Beach Movement, run for five years from FY2019 by the Nature Conservation Society of Japan (NACS-J), is the largest coastal citizen science initiative in the country. Framed as "three actions to protect sandy beaches" — surveying beach wildlife, picking up litter, and using the Beach Notebook — it drew a cumulative total of more than 1.7 million participants over five years.
The results come in hard numbers. 95,000 copies of the Beach Notebook were distributed, the beach wildlife survey gathered 231,682 records, and 17,673,354 pieces of litter were collected. The wildlife survey used the Biome app, and it revealed how sharply species composition differs from beach to beach — small beaches with surprisingly many species, vast beaches with surprisingly few. That larger does not mean richer is a fact only field data can show.
Read the activity report"National Sandy Beach Movement" reaches 1.7 million cumulative participants: a report on five years of activityThe Nature Conservation Society of Japan's five-year summary of its beach citizen science project, publishing results including 231,682 wildlife records and 17.67 million pieces of litter collected.🔗 nacsj.or.jp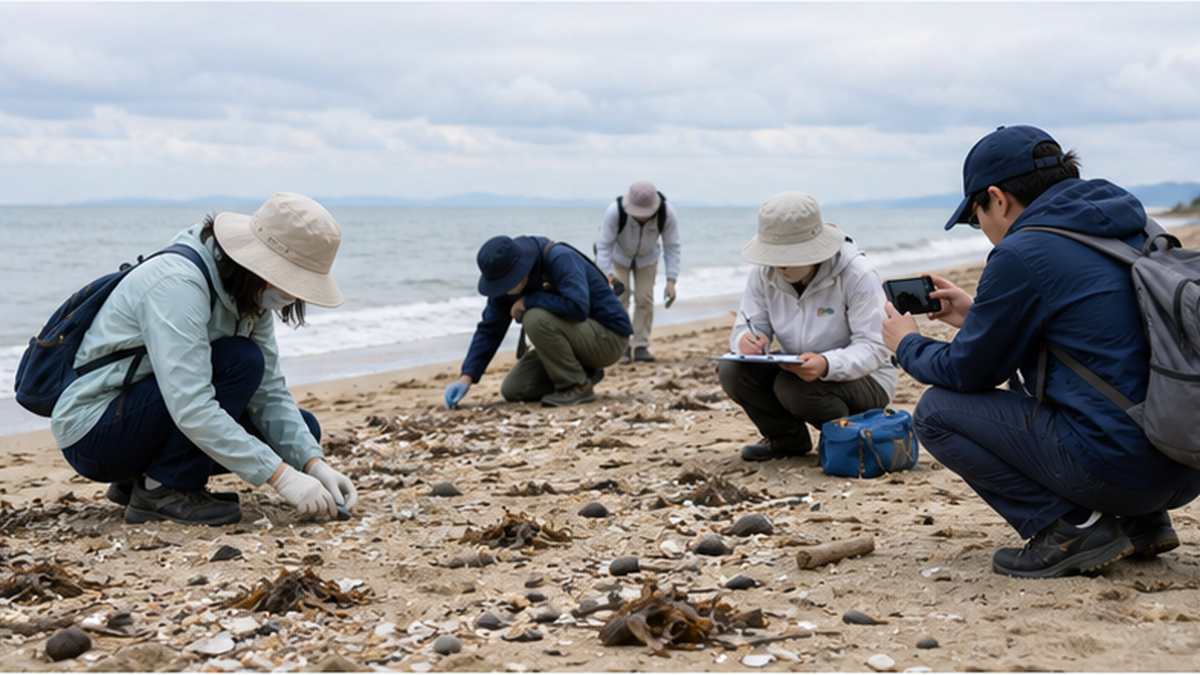
Sea Turtles — A Migration Map Drawn by About 110,000 Tags
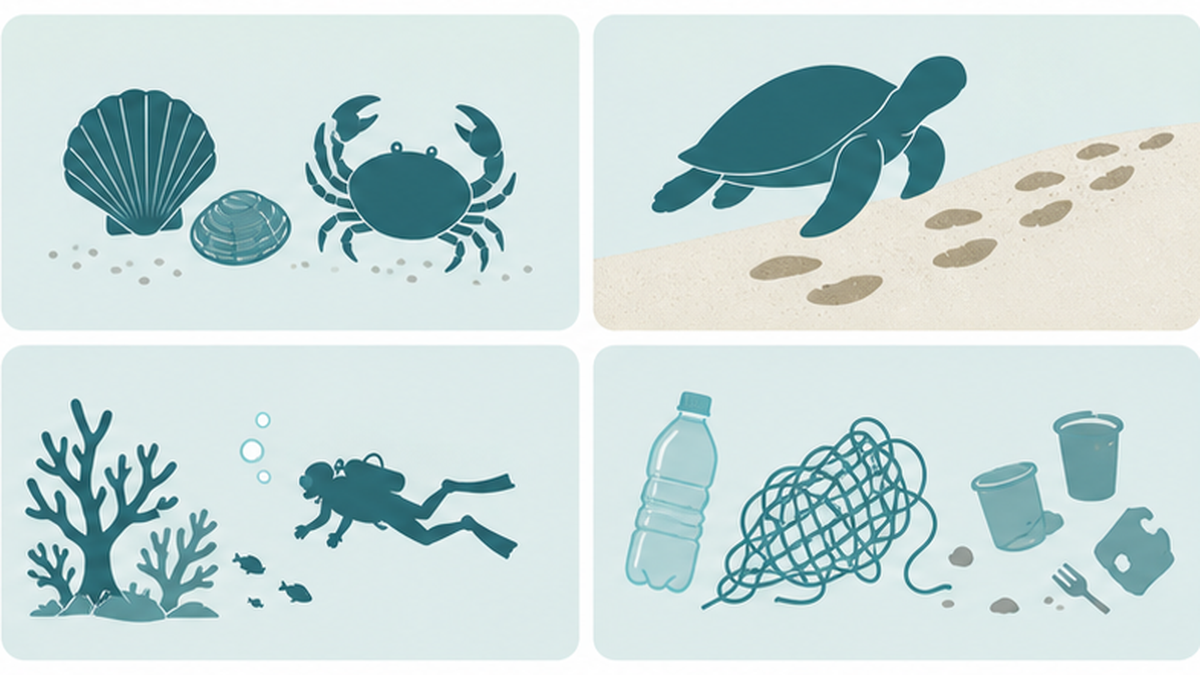
One of the longest-running strands of coastal citizen science in Japan is the sea turtle landing and nesting survey. The method is simple: walk the beach at dawn and record either the turtle itself or the traces it left — tracks and nests. Precisely because it needs no special equipment, it could be carried out nationwide over long periods.
In addition, tagging studies that follow movement and growth through information gathered when tagged individuals are recaptured have used about 110,000 tags in total to date. A single tag only means something when someone somewhere else finds it and reports it. It is a survey that works only because there is a nationwide network of observers. In Shizuoka Prefecture, for example, prefecturally certified conservation surveyors work every day at dawn from May to August, with arrangements that let members of the public accompany them.
Coral Reefs — Reef Check as a Shared Yardstick
On coral reefs, a survey method known as Reef Check is used as a globally shared framework. A line (transect) of set length is laid underwater, indicator organisms are counted along it, and coral cover is recorded. Because the procedure is set out in a standardised manual, anyone who can dive can gather comparable data without being a specialist.
Materials from Japan's Fisheries Agency likewise position Reef Check as routine monitoring for catching changes in coral reefs early, carried out through cooperation among local fisheries cooperatives, municipalities, foundations, and private organisations. When bleaching occurred, where, and how severely — much of that record was left by these eyes on the ground.
Marine Debris — Counting With a Globally Shared Data Card
In the marine debris field, the International Coastal Cleanup (ICC), which the JEAN association has run in Japan since 1990, is the classic case of citizen science. What sets ICC apart is that participants do not simply pick things up: they use a globally shared data card to count and record what they collect by category.
Classifying and counting — so many plastic bottles, so many cigarette filters, so many pieces of fishing gear — makes it possible to infer where the debris came from, and shifts the debate from "there seems to be a lot" to "this particular item stands out." That one extra step of counting turns a clean-up into a policy proposal. For concrete work on the ground, see also beach clean-ups and the reality of stranded debris.
Tidal flats are another place where citizen surveys thrive. They appear for only a few hours as the tide recedes and hold many organisms found nowhere else, so local observation groups play a large role. For the situation tidal flats now face, see conserving and restoring tidal flats.
Who Uses the Data, and How
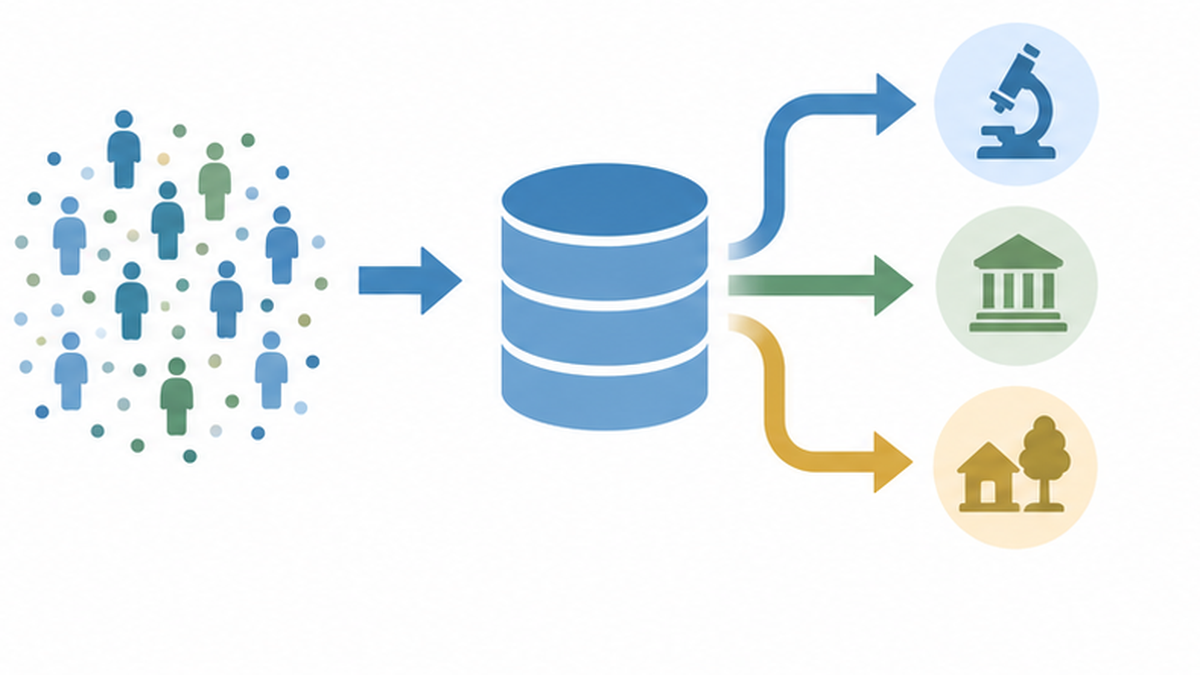
What people who take part in citizen science most want to know is probably this: what actually happens to my records? If that stays vague, participation does not last. So let us follow where the data really goes.
1. Red Lists and Conservation Priorities
To judge a species "endangered" you need distribution and trend data: how many individuals are where, and whether the number is rising or falling. Much of the baseline information used in that judgement is built up from Monitoring Sites 1000, the National Survey on the Natural Environment, and observation records from across the country. The declining trends in the tree sparrow and the skylark shown in the 4th-term report of Monitoring Sites 1000 could only be stated because such long-term records exist.
Conversely, a place with no records is treated not as "absent" but as "unknown." Wildlife in regions nobody has surveyed will not even come up for assessment, however endangered it may be. That is precisely why citizen records filling the blank areas matter.
2. The National Biodiversity Strategy 2023-2030 and 30by30
In March 2023 Japan adopted the National Biodiversity Strategy 2023-2030 by Cabinet decision, setting the goal of achieving "nature positive" — the recovery of nature — by 2030. One of its pillars is 30by30, the international target of effectively conserving at least 30% of land and sea as healthy ecosystems by 2030.
Because existing national parks and protected areas alone do not cover enough area in Japan, "Nature Coexistence Sites" (OECMs) — privately managed land granted official recognition — play a complementary role. What is asked in that process is evidence that the site genuinely holds nature worth protecting, and part of that evidence comes from local observation records. The strategy itself calls for developing people and providing tools for disseminating and using data, in order to promote sound policymaking, decision-making, and citizen participation.
3. In Municipalities, Companies, and Classrooms
It is not only a national-level story. Local governments consult observation data as baseline information for green space planning and environmental impact assessment, and companies gather data to demonstrate the natural value of their sites and operating areas. The more than 9 million observation records accumulated in Biome, used to track the spread of invasive species and to inform urban planning and environmental education, are one example.
| User | How it is used | Qualities the data needs |
|---|---|---|
| National government (e.g. Ministry of the Environment) | Red List assessment, tracking progress on the national strategy, evidence for 30by30 | Nationwide coverage sustained over a long period |
| Local governments | Green space and coastal planning, invasive species measures, environmental education materials | Fine-grained, continuous recording of that particular area |
| Researchers | Distribution models, analysis of climate change impacts, identifying drivers of species decline | Accurate location and timestamps, with the reliability of identification assured |
| Companies | Nature Coexistence Site certification, natural capital assessment of sites, disclosure | A species list for the site and the records that substantiate it |
| Communities and schools | Recording local nature, inquiry-based learning, material for building consensus | Records of nearby places that are easy to understand and share |
When people can see their data being used, they keep taking part
Citizen science projects that last all share one thing: results are given back. Annual reports published, interim reports for participants, distribution maps released. When you can see which dot on the map your one submission became, you are willing to walk it again next year. For the people gathering the data, feedback is not a bonus — it is part of the machinery.
The Weaknesses of Citizen Science, and How They Are Addressed
Citizen science is not a cure-all. Like every other research method, it has its own limits and biases. In fact, it is because those weaknesses have been honestly recognised and techniques developed to correct for them that citizen science data has become usable in research.
1. Records Cluster Where People Find It Easy to Go
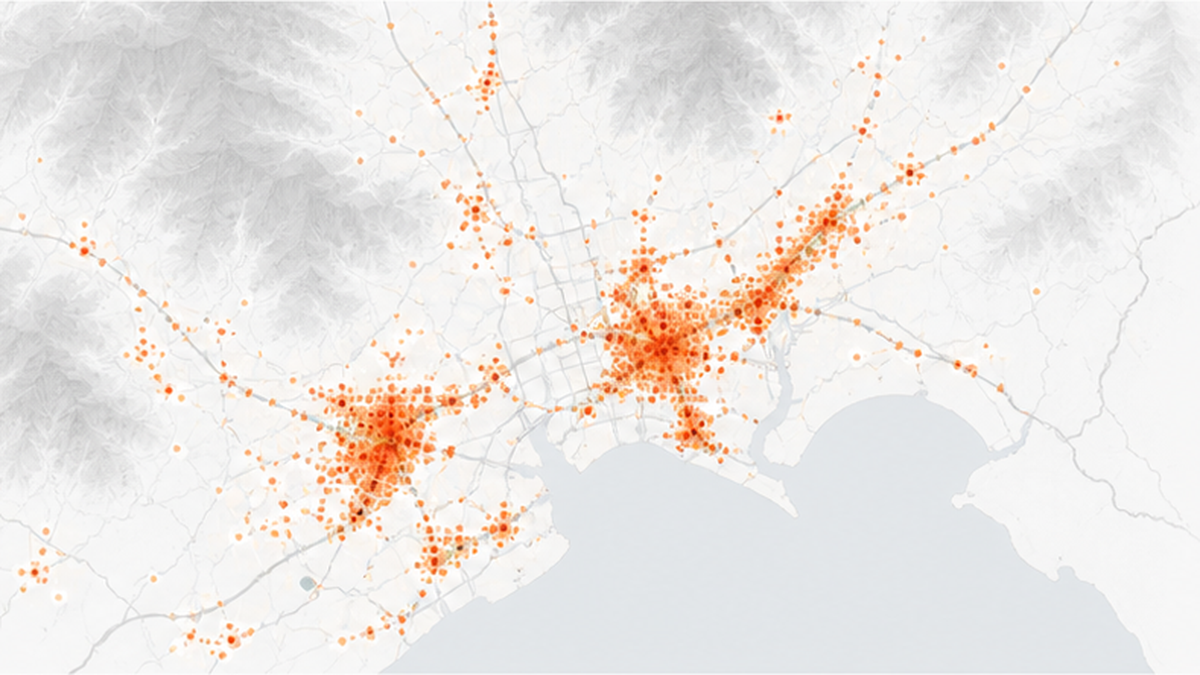
The biggest issue is sampling bias. Citizen observations cluster near stations, in parks, at famous observation spots, and during daylight hours at weekends. Remote mountain valleys, tidal flats at midnight, and rainy weekdays are overwhelmingly thin. As a result, the distribution of records risks reflecting the distribution of human behaviour rather than the distribution of wildlife.
Also, what citizens submit is essentially "it was here" — presence data. Absence data, meaning "I looked and found nothing," is rarely collected. Estimating distribution properly requires both. In conservation ecology, how to select pseudo-absence data that accounts for this bias, and how to evaluate the resulting accuracy, have been discussed as open research questions for presence-only data from citizen surveys.
Countermeasures include statistical correction — estimating observation effort and cancelling out the bias — and, just as importantly, designs that specify survey locations and dates in advance. The National Bird Breeding Distribution Survey assigning routes to 20 km meshes, and Monitoring Sites 1000 fixing its observation points, exist precisely to avoid this skew.
2. Reducing Misidentification
AI that identifies species from photographs is not infallible. Closely related look-alikes, juveniles, and damaged individuals all produce errors. The response adopted by the platforms is confirmation by multiple people (community identification) plus a confidence ranking. iNaturalist's "research grade" category, which supplies only records where multiple users' identifications agree to GBIF as research data, is the leading example.
Participants can help too. Even when you do not know the species, leave a proper photograph. Shoot the whole organism, a side view, and the distinguishing features — the aperture of a shell, a crab's claws, how leaves are arranged on a plant — and a specialist can identify it later. Conversely, register a vague guess as though it were certain and it becomes very hard to correct afterwards. "I don't know" is worth far more than a wrong assertion.
3. The Difficulty of Keeping It Going
Long-term monitoring that runs 20 or 30 years faces the practical problems of ageing participants and a shortage of successors. When the core members of a local observation group retire, the data from that site simply stops. Because the value of long-term data lies in being unbroken, this is serious.
For that reason, projects are increasingly designed with two layers: a casual participant base using apps, and experienced surveyors holding the fixed points. The National Sandy Beach Movement adopted Biome with exactly this in mind — widening the entrance for younger people and families while channelling the accumulated data into the NPO's specialist analysis.
Things to keep in mind when taking part
- Do no harm to wildlife: avoid catching organisms just to photograph them, or leaving overturned rocks as they are (always put rocks on a rocky shore back where they were)
- Handling location data for rare species: publishing precise locations of endangered species can invite poaching and illegal collection. Most platforms offer a feature to obscure locations — use it
- Follow the rules on access and collection: national parks, protected areas, and waters with fishing rights carry restrictions on entry and collection. Check in advance
- Safety first: rocky shores and tidal flats change fast with the tide. Check the tide table and avoid going alone
Observations the Meteorological Agency Gave Up, and Citizens Took Over
An episode in Japan showed unmistakably that citizen science is not a nice-to-have but something whose absence means real loss: the scaling back of phenological observation, and its reconstruction afterwards.
In 2021, All Animal Observations Were Discontinued
For many years the Japan Meteorological Agency carried out phenological observation at meteorological stations nationwide — the flowering of cherry blossom, the first song of the Japanese bush warbler, and so on. Measuring the progress of the seasons through living things, gathered by a consistent method for more than half a century, is climate change indicator data of global value.
Then, from January 2021, animal phenological observation was discontinued entirely, and plant observation was cut back sharply to six species and nine phenomena. What remains is the plum (flowering), cherry (flowering and full bloom), hydrangea (flowering), Japanese silver grass (flowering), ginkgo (yellowing and leaf fall), and maple (autumn colour and leaf fall). The reason was that urbanisation had made it difficult to observe the target organisms around the meteorological stations at all.
The fact that urbanisation itself made observation impossible tells its own story about environmental change. But separately from that, it meant a time series running for decades would break off right there. For long-term data, that is a fatal loss.
Reconnecting the Observations Through Citizen Eyes
What moved in response was cooperation among the Japan Meteorological Agency, the Ministry of the Environment, and the National Institute for Environmental Studies. The three launched a pilot study toward the developmental use of phenological observation, working out an effective survey framework and identifying operational challenges. Notably, the pilot uses the Ministry of the Environment Biodiversity Center's "Ikimono Log" to gather information such as first songs. The portion of the national observation network that shrank has been taken over by a participatory data platform.
The National Institute for Environmental Studies is recruiting surveyors nationwide under "phenological monitoring in partnership with citizen surveyors," and the Nature Conservation Society of Japan has resumed observation with the cooperation of its members. In short, observation once carried out by meteorological station staff has been shared out among citizens across the country.
What this episode tells us
- Long-term monitoring can break off easily when government budgets or structures change
- The only people who can fill that gap are those who go on living in the place
- The handover worked because a receiving data platform (such as the Ikimono Log) was already in place
- A mundane act like recording the cherry blossom flowering date each year becomes, decades later, evidence of climate change
Getting Started Today — A Guide by Purpose
If you have read this far and thought about giving it a go, the entrance is closer than you think. Here it is, sorted by purpose.
Start With One Photo — The Lightest Entry Point
Install an app and photograph what you find on a walk. That is the whole thing. You do not need to know the species name; the AI offers candidates and other users help identify it. Even one record a day is 365 in a year — and they come from your own neighbourhood, a place researchers are unlikely ever to visit.
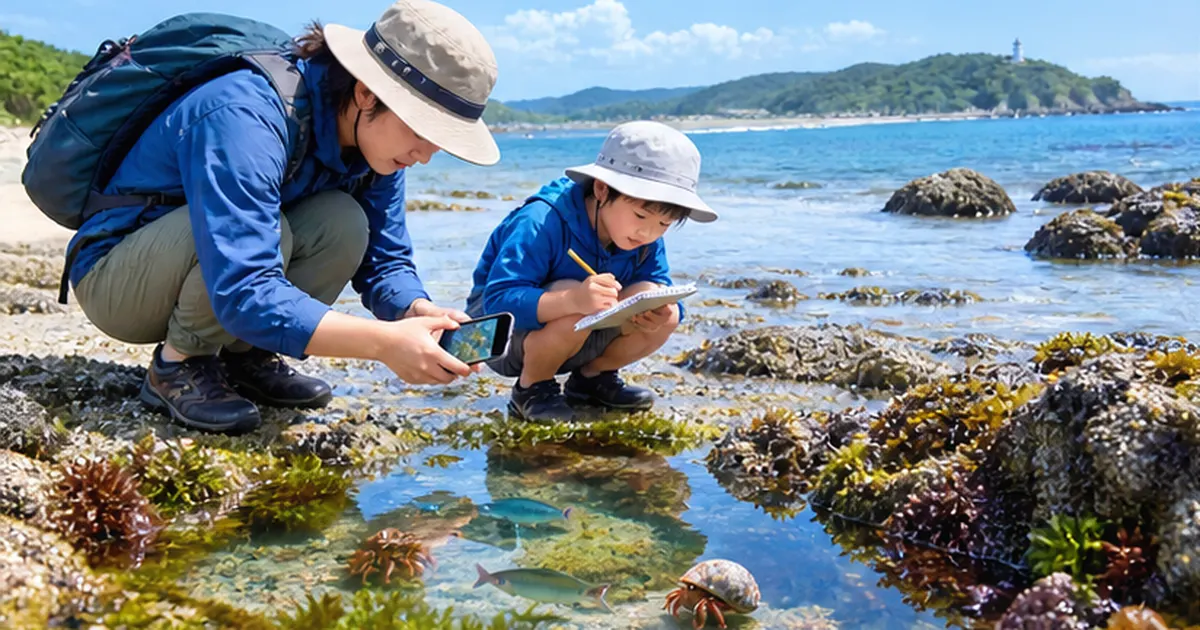
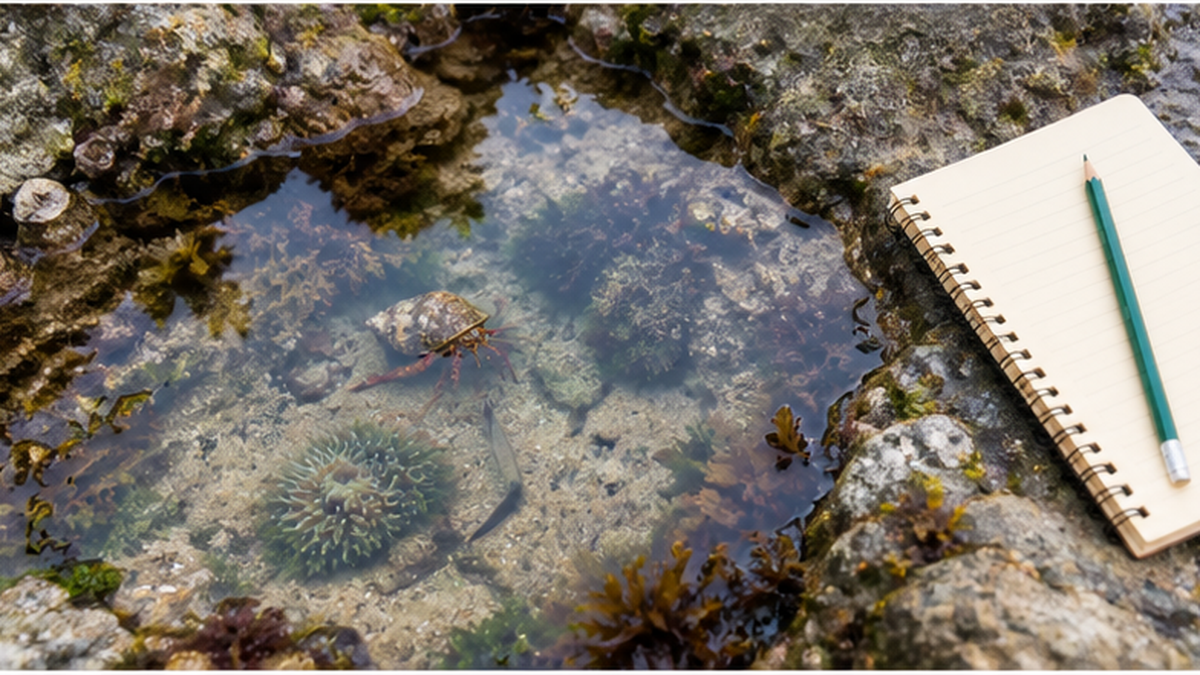
If you get to the coast, tide pools are especially recommended. An astonishing variety of life gathers in a tiny area, and ten minutes of crouching and looking will yield several species to record.
Taking Part as a Family or a School
With children, shell surveys on the beach and litter-counting surveys work well. Picking up, counting, and sorting are themselves the survey, so the results are easy to see. Recording your local beach for a single season makes a perfectly respectable citizen science project for a summer holiday assignment. Learning about ideas like satoumi, the history of Japanese coasts kept rich through human involvement, changes what you see as you walk.
Going Deeper — Holding a Fixed Point
If you want to go one step further, the surest route is joining a fixed-point survey run by a local NPO or conservation group. Each Monitoring Sites 1000 site is looked after by an organisation somewhere in the country, and they sometimes recruit surveyors. Large-scale surveys such as the National Bird Breeding Distribution Survey also call widely for volunteers in the years they run. Visiting the same place every year — that simple act produces the most valuable data of all.
Five tips for turning your records into data that gets used
- Turn location services on: a record without a location cannot be used as distribution data. Check that GPS is enabled when you shoot
- Post even when you don't know the species: submit it as unidentified and someone will identify it. An honest "unknown" is worth more than a shaky assertion
- Take several shots from angles that capture the features: whole body, side view, distinguishing parts. Leave enough for a specialist to work from later
- Record the common species above all: it is the rise and fall of ordinary species that indicates environmental change. Even the sparrow's decline emerged from unremarkable records piling up
- Record the same place repeatedly: ten years of ordinary records say far more than one rare sighting
The Future That "Science You Take Part In" Opens Up
The value of citizen science is not only that data accumulates. Its long-term significance lies in this: people who record for themselves become able to notice change in their own place. Fewer shell species than last year; a southern fish that was not here before — such realisations do not come from looking at numbers alone.
And people who hold records gain the standing to speak about that place. When a coastal development plan appears, the fact of having ten years of observation records is far stronger than the memory that "there used to be more life here." Citizen science is a contribution to science and, at the same time, a way to acquire the language to speak about your own environment.
Summary of this article
- Citizen science is participatory research by citizens and scientists together, with the data collected on the premise that it will be used in papers and government reports
- Japan's foundations are the Ministry of the Environment's Monitoring Sites 1000 (since FY2003, about 1,000 sites nationwide), the Ikimono Log (since 2013), and the National Bird Breeding Distribution Survey (2016-2021, 2,106 volunteers)
- Smartphones and AI identification lowered the barrier: Biome passed 10 million cumulative posts in seven years, and iNaturalist exceeded 200 million observations (as of September 2024)
- On the coast there are beaches (the National Sandy Beach Movement: 1.7 million participants and 231,682 wildlife records over five years), sea turtle tagging (about 110,000 tags in total), Reef Check, and the International Coastal Cleanup
- The data feeds Red List assessments, the National Biodiversity Strategy 2023-2030, 30by30, municipal planning, and corporate Nature Coexistence Site certification
- The weaknesses are spatial bias, misidentification, and continuity — corrected through survey design, multi-person verification, and two-layer participation models
- When the Meteorological Agency's phenological observation was sharply cut back in 2021, participatory monitoring took over the gap
What you can do today
- Install one wildlife recording app and post a single observation from your commute or a nearby park
- Next time you go to the sea, spend ten minutes looking into a tide pool and record what you find
- Look up fixed-point surveys that local conservation groups or observation circles are recruiting for
- When you join a beach clean-up, add "count them by category" to "pick them up"
- Go back to the same place in the same season next year and record it again (this makes the strongest data of all)
References and sources
- Ministry of the Environment, Biodiversity Center — "Monitoring Sites 1000" – Official site of the ecosystem monitoring programme covering about 1,000 sites nationwide since FY2003
- Ministry of the Environment press release — Publication of the Monitoring Sites 1000 4th-term summary report (overview) and the satoyama survey FY2005-2022 summary report – Results of 20 years of analysis: declines in familiar wildlife, climate change impacts, and the spread of invasive species
- Ministry of the Environment press release — On the National Survey on the Natural Environment: National Bird Breeding Distribution Survey (2016-2021) – Results of the breeding distribution survey by 2,106 volunteers at 2,344 locations nationwide
- Ministry of the Environment, Biodiversity Center — "Ikimono Log" – Launched October 2013. A system consolidating and serving wildlife information from government, local authorities, specialists, and individuals
- Ministry of the Environment press release — Launch of the pilot study toward the developmental use of phenological observation – The shift to participatory surveys through cooperation among the Meteorological Agency, the Ministry of the Environment, and the National Institute for Environmental Studies
- Ministry of the Environment — "National Biodiversity Strategy 2023-2030: A Roadmap Toward Nature Positive" – Adopted by Cabinet decision on 31 March 2023. Covers 30by30, Nature Coexistence Sites, citizen participation, and data use
- Ministry of the Environment — "30by30" portal – The target of conserving over 30% of land and sea by 2030, and the Nature Coexistence Site (OECM) scheme
- Ministry of the Environment, Biodiversity Center — "Sea turtle landings and nesting (shallow-water ecosystem survey)" – Information on nationwide sea turtle landing and nesting surveys and tagging studies (about 110,000 tags in total)
- Fisheries Agency of Japan — "Activities by fishers to protect coral reefs" – The Reef Check method and the implementation structure involving fisheries cooperatives, municipalities, and private organisations
- Nature Conservation Society of Japan — "'National Sandy Beach Movement' reaches 1.7 million cumulative participants: a report on five years of activity" – Results including 231,682 wildlife records and 17,673,354 pieces of litter collected
- BioScience — "iNaturalist accelerates biodiversity research" (2025) – Over 200 million observations and 3.3 million participants. 1,410 related papers in 2022; 6.3% of GBIF (37.2% excluding birds)
- JEAN — "International Coastal Cleanup (ICC)" – Run in Japan since 1990. A citizen survey classifying and counting debris with a globally shared data card
* Listed in order of reliability: government and academic institutions > peer-reviewed papers > specialist organisations > trusted media