⚡ In short
Anyone can join citizen science surveys of rocky shore wildlife and marine litter. Using examples such as Japan's Monitoring Sites 1000, the International Coastal Cleanup and Reef Check, we explain how to take part, recording tips and how the data are used.
Ocean change is more than researchers can track alone.Watching Japan's long coastline requires the eyes and hands of local people, and records gathered by citizens are used in national surveys and international research.
Rocky shore life, litter on the beach, the condition of coral reefs: each has a way of surveying that anyone can join. But to be useful as data, records need to be taken in the right way.
Drawing on real examples such as the Ministry of the Environment's Monitoring Sites 1000, the International Coastal Cleanup and Reef Check, this article explains how to take part and how the data are used.
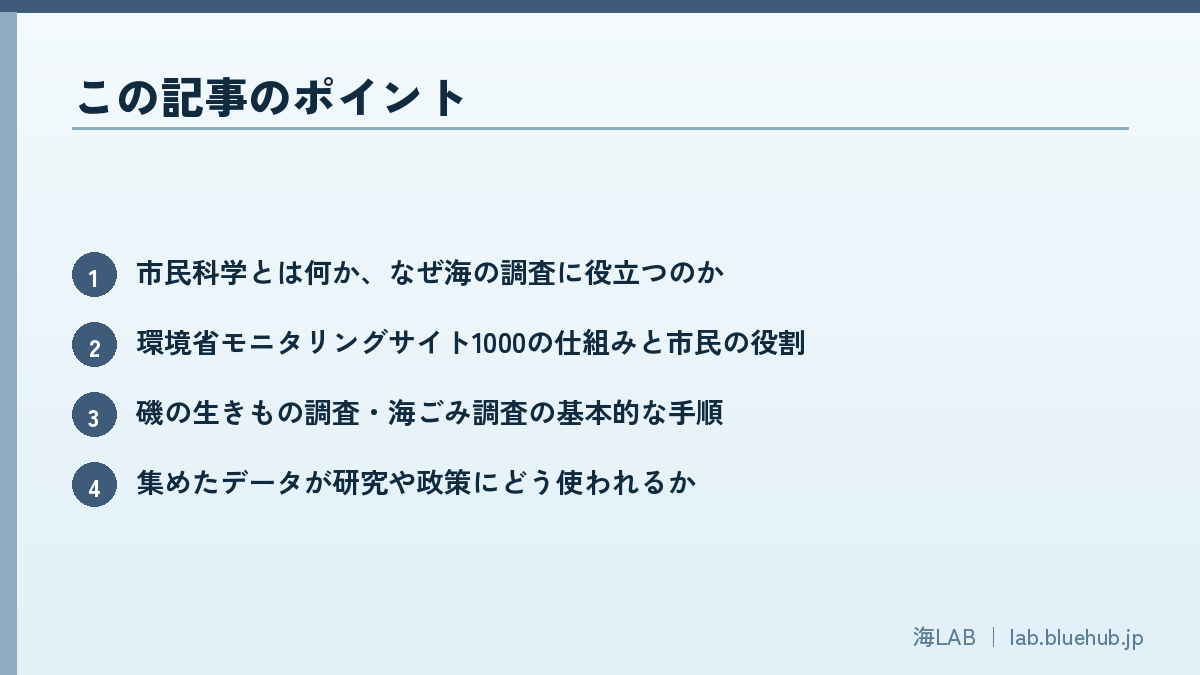
What you will learn in this article
- What citizen science is and why it helps ocean research
- How Monitoring Sites 1000 works and the role of citizens
- Basic steps for rocky shore and marine litter surveys
- How the collected data are used in research and policy
- How to start taking part safely and respectfully
What is citizen science? Why ocean surveys welcome everyone
The basics of citizen science
Citizen science is an approach in which not only professional researchers but ordinary people take part in scientific surveys and data collection. It has long been practiced in many fields, including bird watching, star records and weather observation. In the ocean, too, opportunities to take part are spreading across Japan: records of animals found on rocky shores, counts of litter by type washed up on beaches, and regular coral reef surveys.
Participants do not need to be researchers. What matters is recording "by a set procedure," "at the same place," and "repeatedly." Each record is small, but when hundreds or tens of thousands are combined, they become data of a breadth and length that researchers could not obtain alone.
The ocean is too big, and there are too few hands
Japan has a very long coastline and diverse environments, including rocky shores, tidal flats, sandy beaches, seaweed beds and coral reefs. It is unrealistic for a small number of researchers to survey all of them regularly. Moreover, ocean change does not happen suddenly but gradually over years to decades. Noticing it takes eyes that keep watching the same place for a long time, and this is where local people's strength counts.
- Spatial coverage: if surveyors are on coasts nationwide, regional differences can be compared
- Long duration: surveying the same place at the same time every year reveals trends of increase and decrease
- Early detection of anomalies: people who know a place well notice when "something is different"
- Learning and interest: taking part itself deepens understanding of and interest in the ocean
Three roles citizen science plays
Citizen science plays three main roles. The first is data collection, which widens the manpower and range of surveys. The second is education and outreach, in which participants see the state of the ocean with their own eyes and deepen their understanding. The third is collaboration and bridging to policyby turning local voices into scientific evidence and delivering them to government and researchers. Once these three start turning, a survey grows from a simple task into an activity that protects the local sea.
Researchers also benefit. Surveys by experts alone are limited in the places and frequency they can cover by budget and staffing. With citizens' help, these limits can be eased and finer changes in time and space captured. Citizens, in turn, learn how to survey and identify species from experts. A relationship in which both bring their strengths is the ideal form of citizen science.
For the spread of citizen science across Japan, see also What is citizen science? Wildlife surveys anyone can join as well.
National surveys are supported by citizens too: Monitoring Sites 1000
A long-term survey at about 1,000 sites nationwide
The Ministry of the Environment's "Monitoring Sites 1000" (Monitoring Project of Important Ecosystems) is a national long-term survey that began in fiscal 2003. It sets about 1,000 fixed sites across the country covering Japan's representative ecosystems and keeps surveying them over the long term and quantitatively, with the aim of catching ecosystem changes and anomalies early. Its targets are not limited to the sea; they include mountains, forests, satoyama, lakes, coral reefs and coasts.
The part related to the sea is the "coastal survey." The Biodiversity Center of Japan leads surveys of shallow-sea environments such as rocky shores, tidal flats, eelgrass beds and seaweed beds. A summary report covering five years, fiscal 2008 to 2012, has been published by the Ministry of the Environment, and its results include capturing in data the sudden impact of the tsunami from the Great East Japan Earthquake.
The people who carry out the survey
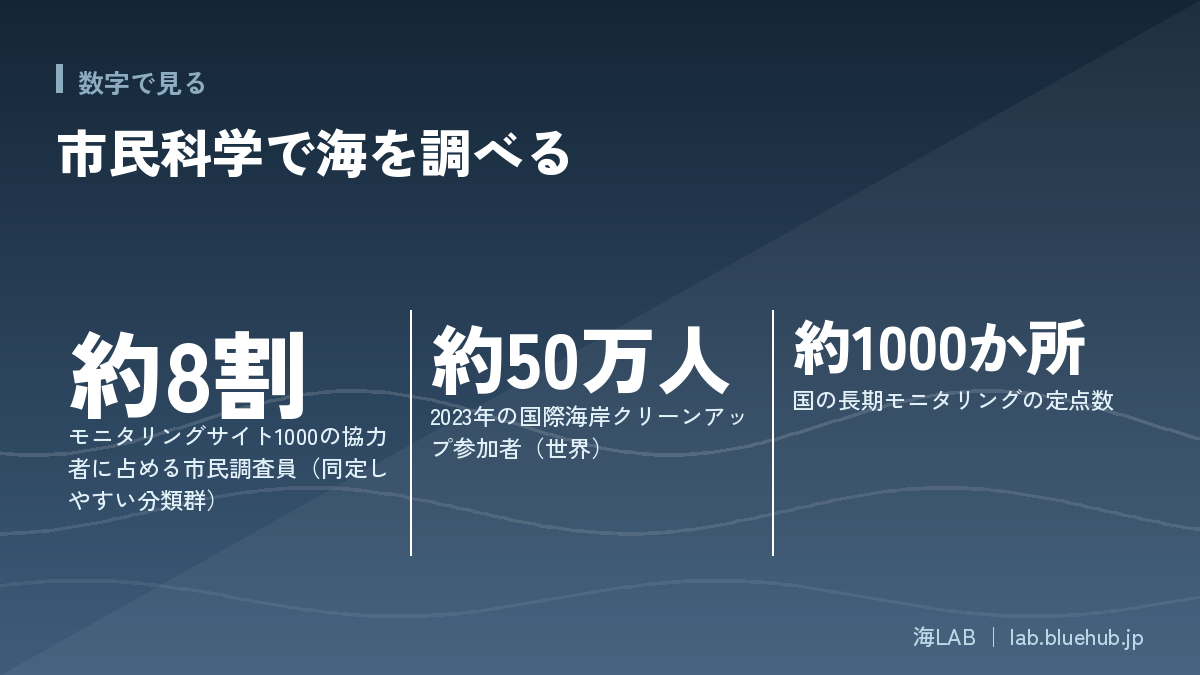
This survey is carried out by the Ministry of the Environment commissioning coordinating organizations in each field, with local experts and citizens taking part at each site. For taxa that many people are interested in and that are relatively easy to identify, citizen surveyors play a central role, and citizens are described as making up about 80% of all survey contributors. According to media reports, participants as of April 2024 numbered 5,120, counting researchers and citizen surveyors together.
Key points
- Even in a national long-term survey, most field records are supported by citizen surveyors
- Surveys follow a manual, so results can be compared under the same conditions no matter who surveys
- Results are compiled into a report every five years and published
However, Monitoring Sites 1000 is not a scheme anyone can drop into; participation is basically through the survey groups at each site. If you are considering taking part, it is safest to check information from local survey groups or the Biodiversity Center of Japan.
How rocky shore surveys work: counting inside a quadrat
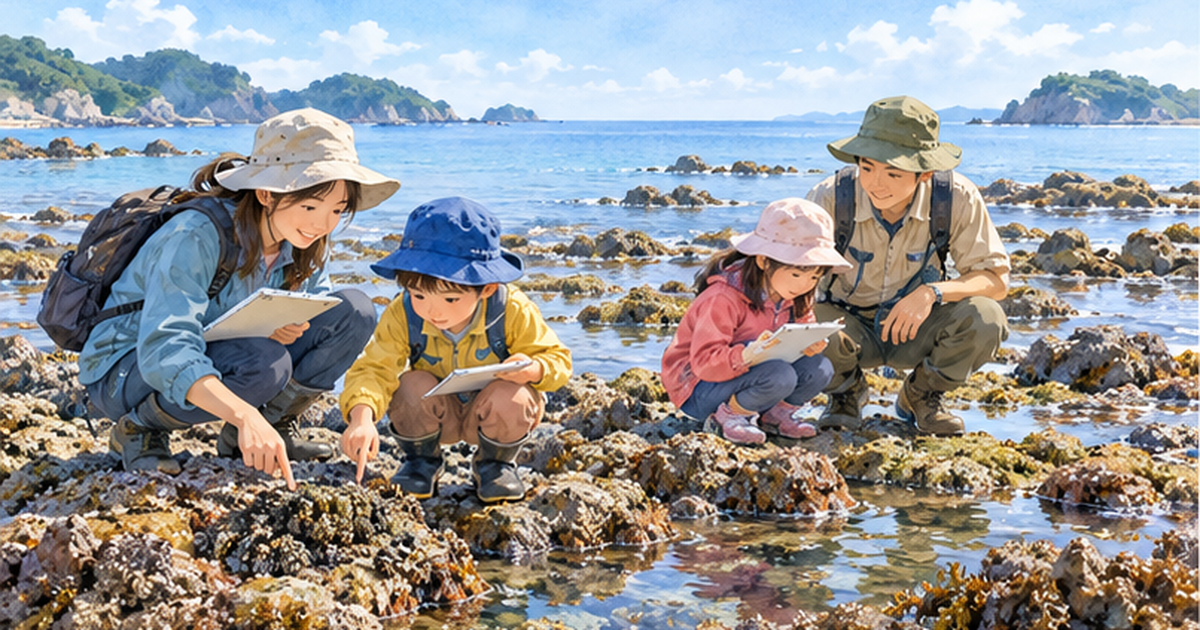
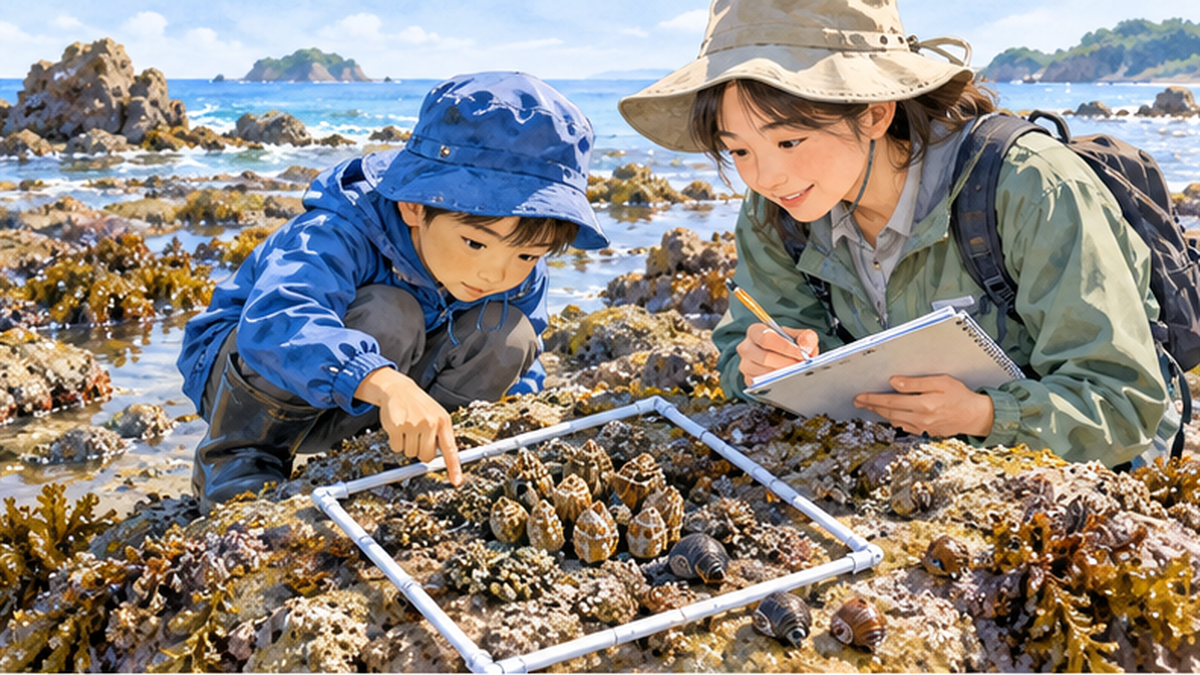
In rocky shore surveys, square frames called quadrats are placed in the upper, middle and lower parts of the intertidal zone (the band submerged at high tide and exposed to air at low tide), and the animals appearing inside the frame are recorded. Reports describe a method of setting many quadrats at each site and recording the species that appear. For example, acorn barnacles and limpets (cap-shaped shellfish) may be seen in the upper intertidal zone; the cast of species changes from zone to zone.
The frame size and counting details are set in each year's survey manual, so when you actually take part, check the latest report and manual on the Biodiversity Center of Japan website.
Why keep surveying the same place the same way?
The value of long-term monitoring lies in being able to compare. If places or methods changed with every survey, you could not tell whether numbers had increased or whether you had simply surveyed a different place. Monitoring Sites 1000 fixes its survey sites and follows a manual so that each year's results can be compared with the same yardstick.
Suppose, for example, that over several years the cover of barnacles (the share of rock they cover) at the same height on a rocky shore decreases and another species increases. If the method is constant, this change can be read as a sign of environmental change. The impact of sudden events such as a tsunami can also be followed, "how much it changed" and "how long it takes to recover," only when data from before and after are available.
Where citizen surveyors' eyes make a difference
- By visiting the same rocky shore every year, surveyors can notice small changes
- The experience of local fishers and residents is reflected in survey planning
- Returning results to the community raises interest in the ocean
How to join a rocky shore wildlife survey
Start by getting to know your own shore
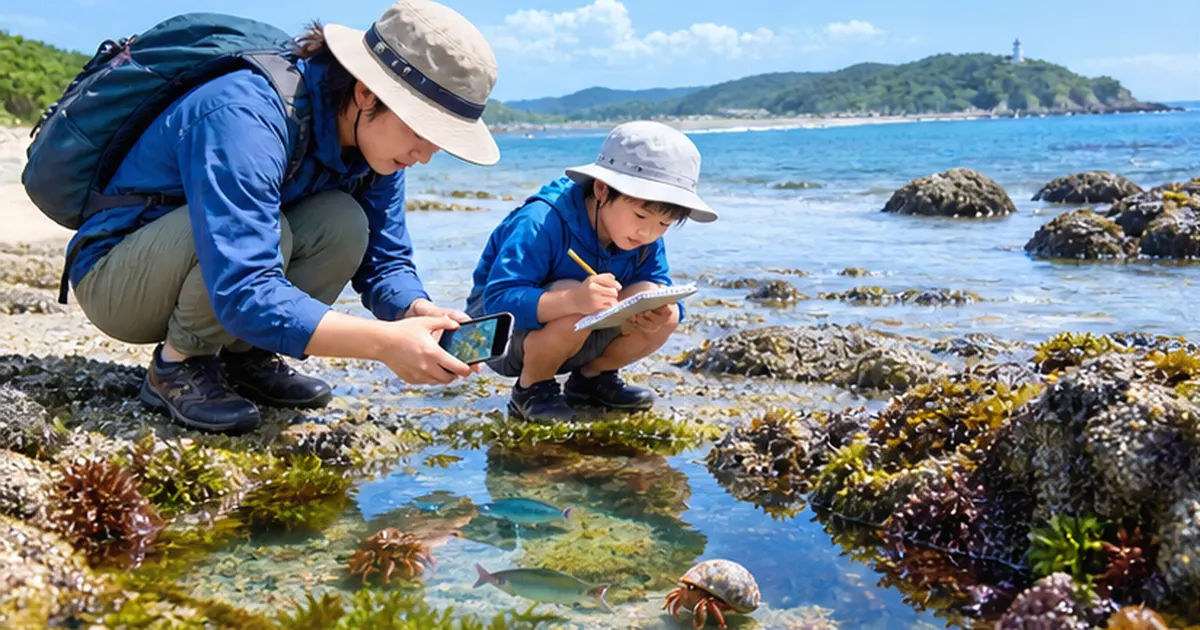
Even if it is not a full-scale long-term survey, you can start today by observing and recording wildlife on a nearby rocky shore. Check the tides, go at low tide on a spring tide, and photograph and record the animals on the rocks. Even this is a fine first step. The basics of tide pooling are also explained in our The Complete Guide to Enjoying Tide Pooling as well.
Tips for recording: repeat under the same conditions
- Write down the date and tide level: record what day and time it was and whether the tide was out (or coming in)
- Decide on a place: choose a point on a map or a landmark rock and observe the same place every time
- Decide on an area: place a frame (for example, a square made from string) and count only inside it
- Keep photos: photograph the whole frame and any animal of interest so you can review them later
- Write "unknown" for what you cannot identify: do not force a name; keep the photo and look it up later
Tools and where to submit records
The Biodiversity Center of Japan's "Ikilog" is a site where you can submit and share observations of familiar wildlife. It opened in October 2013 and, as of August 20, 2019, had 4,775,445 observation records and 5,167 registered users. Part of the posted data is also provided to GBIF (Global Biodiversity Information Facility), which gathers biodiversity information worldwide.
There are other places to put records too, such as apps that identify species from photos and let you share them with people worldwide, and survey projects run by local natural history museums and NPOs. You can choose to suit your purpose, but wherever you record, the basic information of date, place and photo is equally important.
Manners and safety in observation
- Return animals to where you found them (do not take them home, and put rocks back if you turn them over)
- Check when the tide will come in, and do not go alone to places with poor footing or onto rocky areas
- Check collection rules in no-entry zones, protected areas and places with fishing rights
- When going with children, prepare life jackets and non-slip shoes
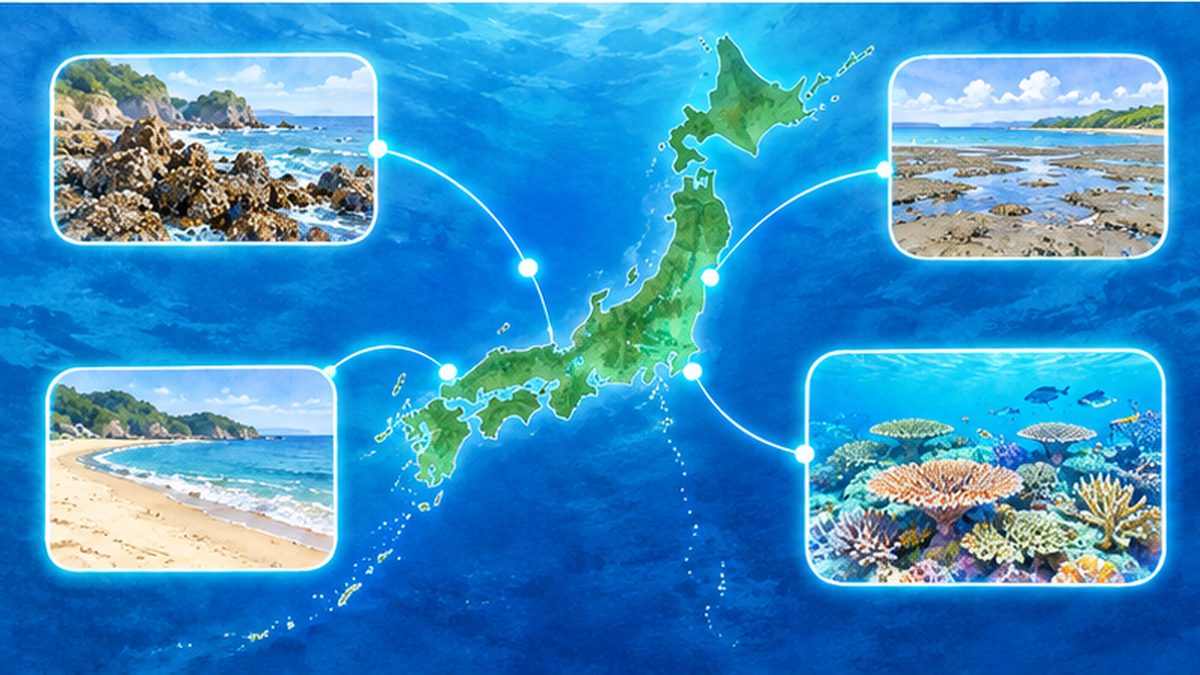
Typical animals you can meet on rocky shores
On Japan's rocky shores, the cast of species changes with height in the intertidal zone. At the top are barnacles and small snails that withstand drying; in the middle are goose barnacles, chitons and sea anemones; lower down appear sea urchins, seaweeds and starfish. This "zonation" is the result of animals adapting to conditions such as waves and drying. For tide pool animals, see A Field Guide to Tide Pool Animals for details.
When observing, do not try to identify everything; first narrow down to "a few conspicuous species." Use field guides and identification apps, record only what you can be sure of, and mark the rest "unknown." A small number of accurate records is easier to use in later research than a large number of vague ones.
A day of observation (example)
- The day before: check low tide times on a tide table, and look at the weather and wave forecast
- Before leaving: prepare the record sheet, string frame, camera, non-slip shoes and drinks
- 1–2 hours before low tide: arrive on site and confirm the safe area and a guide for when to withdraw
- During observation: place the frame, take photos, and record species and numbers
- Withdrawal: leave before the tide starts to come in, and take your litter home
- After returning home: organize photos, look up what you could not identify and submit your records
To prevent accidents
- When the tide comes in, rocks you walked on the way out can be underwater on the way back
- Stay away from rocky areas on days with high waves or swells
- Avoid acting alone, and leave early if the weather looks like turning bad
Counting what is on the shore: marine litter surveys
The International Coastal Cleanup (ICC): a worldwide survey
The world's largest citizen science effort on marine litter is the International Coastal Cleanup (ICC), led by the US NGO Ocean Conservancy. Participants pick up litter on the shore and record the count by type on a data card. In Japan, the NPO JEAN has served as the national contact.
The scale shows in the numbers. According to JEAN materials, in 2017, 789,138 people took part from 107 countries and regions, and Japan's cumulative participants from 1990 to 2017 were 387,116. According to Ocean Conservancy, about 470,000 people took part across 97 countries in 2022, and in 2023 about 500,000 people collected more than 14 million pieces of litter. Since the start in 1986, the cumulative total is said to be more than 18 million volunteers and about 385 million pounds (about 170,000 tons) of litter.
Not just picking up, but counting
The hallmark of the ICC is not to "pick up and finish" but to "count and record." By recording the number of each item such as cigarette butts, plastic caps, plastic bags, PET bottles and fishing gear, the characteristics of the litter on that shore become visible. In a study analyzing 22,508 land-based cleanups (118 countries) from 2011 to 2017, the most commonly found item was cigarette butts.
In the 2024 domestic campaign compiled by JEAN, the total number of entries was 290, and 79% of them carried out cleanups that investigate using the ICC data card. In Japan too, the shift from "picking up" to "investigating" is spreading.
Basic flow of a litter survey
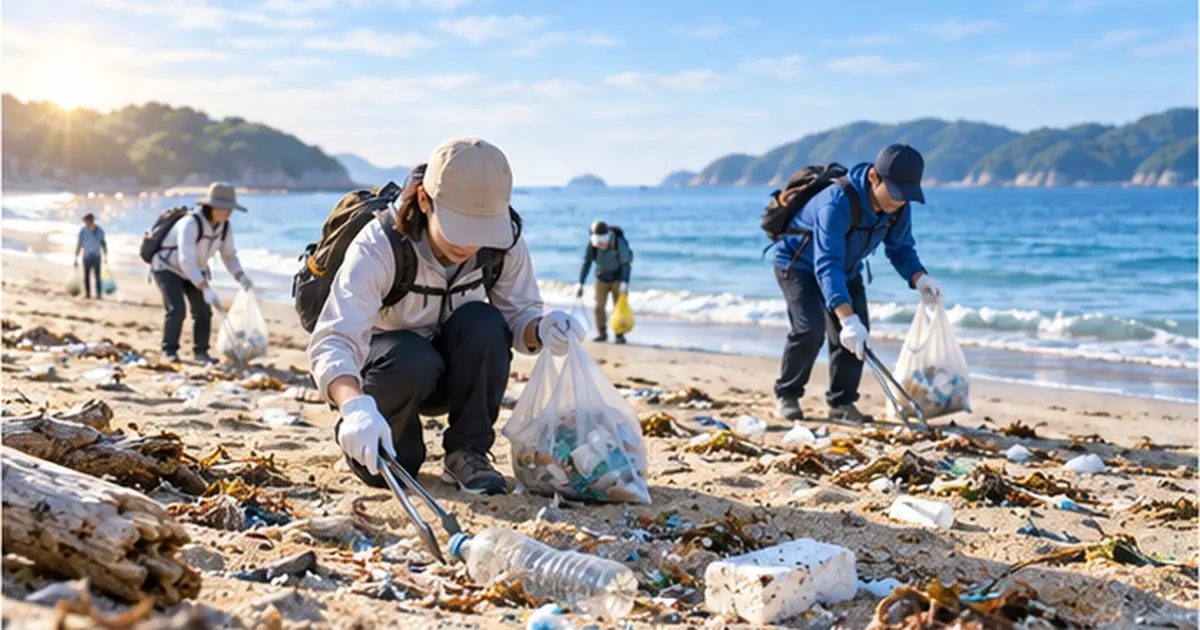
- Decide the section: decide the length of shore (for example, 100 m) and depth, and use the same area every time
- Pick up safely: use gloves, tongs and bags, and do not touch hazardous items (syringes, glass, chemical containers)
- Classify and count: count one by one by item on the data card
- Record and submit: write the date, place, number of participants and time taken too, and submit to the organizer
For the reality and sources of beach litter, see Beach Litter Washing Ashore: What It Really Is, and for how smartphone-based surveys work, see Marine Litter Surveys by Smartphone. For how to start cleanup activities themselves, see What is a beach cleanup? How to join and what to bring.
Litter commonly found, and the background
The litter found on shores differs greatly by place and season. On beaches with many tourists, cigarette butts and beverage containers stand out, and in areas with active fisheries, fishing gear is often found. Near river mouths, litter flowing in from rivers tends to increase. By accumulating records by item, you gain clues to "where this shore's litter comes from." For the flow of litter from rivers to the sea, see Plastic Litter Flowing from Rivers to the Sea for an explanation.
Some litter drifts ashore across national borders. Not only domestic sources but also litter that comes from far away on ocean currents exists, and its reality is introduced in Drifting Litter Across Borders. Citizen data can also help back up such wide-area movements.
Points to note when recording
- Unify how you count: follow the group's rule on whether a fragment counts as "one item" or "one item as a whole"
- Record litter you could not collect too: for items too large to collect, record a photo and the location
- Do not touch hazardous items: for syringes, chemical containers and anything suspected to be unexploded ordnance, do not touch them and contact the local government or police
- Note the time and number of people: so counts can later be converted to "per person per hour" and compared easily
Citizen records that protect coral reefs and marine life
Reef Check: surveys by trained divers
In the field of coral reefs, there is a worldwide citizen-participation survey called Reef Check. Trained divers and local residents survey the state of corals, fish and benthic organisms by a set method. According to Reef Check, since its founding about 20,000 surveys have been conducted on more than 5,000 reefs, and related scientific papers number more than 150.
In Japan too, according to Ministry of the Environment materials, surveys are carried out every year and the data are provided to GCRMN (Global Coral Reef Monitoring Network) and ReefBase. A 2008 conference report, based on ten years of monitoring in Okinawa, showed that recovery is slow on coastal reefs affected by sediment from land. It is an example of long-term data collected by citizens concretely showing a conservation issue.
Capturing changes in familiar seas
On rocky shores, tidal flats and eelgrass beds too, continuing records over the long term reveals changes in the distribution of living things. For example, a record of a species previously seen only in southern seas being found on a northern coast offers a clue for thinking about environmental changes such as rising water temperature. However, the cause cannot be determined from individual sightings alone. Only when data from multiple sites and multiple years are overlaid and examined by experts does the meaning of a change become clear.
New methods that investigate living things from genes in the water have also appeared. This is introduced in detail in What is environmental DNA?, and attempts to combine such technology with citizens' water sampling and observation are also progressing.
Summary of this chapter
- In coral reefs, trained citizen divers take part in an international survey network
- Because long-term data exist, issues such as delayed recovery can be shown in numbers
- Identifying causes requires multi-site, multi-year analysis by experts
How to take on underwater recording
Coral reef and seaweed bed surveys require diving skills and training in survey methods. Organizations such as Reef Check give participants prior training and keep data reliable by bringing surveyors to a common skill level. People who do not dive can also take part from land, for example in beach litter surveys, photo organization, data entry and helping run events.
For coral reefs and ocean environmental problems, see Why the Coral Triangle Is the Center of Marine Diversity as well.
Land-based activities connect to ocean surveys too
Ocean surveys are connected to life on land. River water quality, urban litter and nutrients from farmland eventually flow into the sea. Observing wildlife in your garden or on your balcony, and wildlife surveys in rice paddies and rivers, are also entrances to thinking about the health of the sea.How to Attract Wildlife to Your Garden or Balcony. It is also a good approach to widen your interest to the ocean from familiar efforts like this.
What are the collected data used for?
Use in research and policy
The data of citizen science have meaning only when they are used in research and policy, not just "collected and left." In a marine litter example, a study published in the journal Science in 2025 (Papp and Oremus) used citizen science data from more than 45,000 shoreline cleanups in the United States (45,067) to examine the effect of policies such as plastic bag bans and fees. According to media reports, in areas with such rules the share of bags in collected litter fell by 25–47% (figures are from media reports; check the original paper for exact values).
In Europe, citizen science shoreline litter data have also been used in discussions on the Single-Use Plastics Directive (SUP Directive). The inclusion of cigarette filters among regulated items is cited as an example of data-based policymaking.
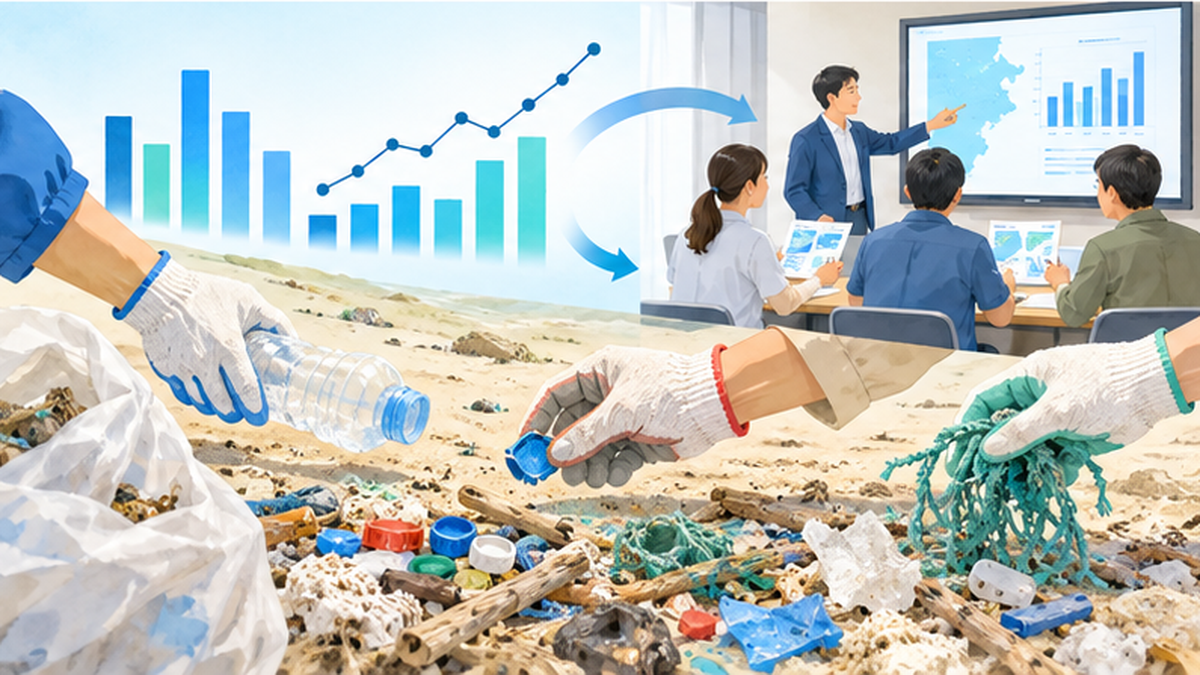
The value of data is decided by using the same method
Whether researchers can use data depends on quality and consistency. A study in Western Australia reported that a community-run beach litter survey gave results consistent with a national standardized citizen science survey, and that plastic lids of takeaway beverages and cigarette butts decreased significantly. In other words, if a standard method is followed, local efforts may also be usable for policy evaluation.
Why publish and share data
Many citizen science projects publish the data they collect. Just as part of Ikilog's data is provided to GBIF, sharing across borders makes the data usable in research on global issues such as climate change and the spread of invasive species. That your records become part of the world's research is one of the great appeals of taking part.
How data become research
- Observe and record: participants record date, place, species and numbers
- Aggregate: organizations or secretariats gather the records and standardize the format
- Verify: experts check photos and descriptions and correct errors
- Publish and share: publish as databases or reports
- Analyze and use: researchers and government analyze trends of change and policy effects
Of this flow, participants handle the first step, "observe and record," but data gain meaning only through the whole chain. That is why humble tasks such as meeting submission deadlines and unifying formats are actually very important.
Thinking about local uses
Citizen science data help not only national and international policy but also local life. Examples include reviewing coastal use rules, selecting priority sites for cleanup activities and creating teaching materials for school environmental learning. Data collected locally are easier for local people to take as their own matter and have the strength of tending to change behavior.
The first step: a practical guide to keep going without strain
A guide to choosing where to take part by purpose
| What you want to do | Recommended activity | What to prepare | Difficulty |
|---|---|---|---|
| Learn about marine life | Rocky shore observation and recording, posting to Ikilog | Smartphone, field guide, tide table | Easy |
| Learn the reality of marine litter | Cleanup using a data card | Gloves, tongs, bags, record sheet | Easy to moderate |
| Protect coral reefs | Training by local survey groups such as Reef Check | Diving certification, taking the training | Difficult |
| Contribute seriously to research | Join projects of local survey groups or museums | As instructed by the group | Moderate to difficult |
Three tips for keeping it up
- Set a frequency: at a pace you can sustain, such as once a month or each season
- Build a community: it is easier to continue with family, school or local groups
- Review your records: line up photos and notes after a few months and you will notice changes
When taking part with children
Examples of using these in school and community learning are increasing. Rocky shore observation and coastal surveys offer a chance to confirm for yourself what is learned in textbooks. What matters is to share safety management and a gentle way of treating nature beforehand.
What you can do from today
- Find a nearby shore or rocky area and the date of the next spring tide
- Leave one observation record with date, place and photo on your smartphone
- Search for a local beach cleanup or survey event and book one
- If the event uses data cards, try taking the recorder role
Checklist before you join
- I have checked the organizer's purpose, methods and handling of data
- I have checked insurance coverage (such as volunteer insurance)
- I have checked the tide, weather and wave forecast and decided the criteria for cancelling
- I have prepared my belongings (gloves, drinks, hat, non-slip shoes, first-aid kit)
- I have checked rules on entry and collection (protected areas, fishing rights, private land)
Taking part online
Even if you cannot go to the site, there are ways to take part. Examples include checking species names on posted photos, organizing and entering observation data, and helping publicize surveys run by local governments and groups. Even people with limits on physical strength or time can contribute as members of citizen science.
Limits and challenges: using citizen science well
How is data quality ensured?
Citizen science has several challenges: misidentification of species, variation in survey effort (time spent and number of people), and records being biased toward easy-to-survey places. To reduce these, many projects provide survey manuals, prior training, expert verification and photo submission.
Quiet continuity matters more than a big discovery
The value of citizen science is not only in finding rare animals. Rather, the humble accumulation of records, asking whether very common species have increased or decreased and how the state of the same place changes each year, is the foundation for reading change. This is also why the national Monitoring Sites 1000 stresses long-term continuity.
What participants should keep in mind
- Load on nature: do not trample the area while observing, and do not harm living things
- Personal and location information: do not publish the location of rare species, and check the privacy settings of posting sites
- Overgeneralizing: do not conclude "decreased" or "increased" from only a few observations
Citizen science is a way for researchers and citizens to cooperate as equals to deepen understanding of the ocean. The more people survey, the better we understand the ocean, and the more options we have to protect it. Start with small records at a nearby shore.
Understanding bias in data
Citizen science data tend to be biased toward "places people can easily reach," "days of good weather" and "weekends." For this reason, a place with few records cannot be interpreted as "a place with no wildlife." Researchers analyze with survey effort (people and time) taken into account to reduce the effect of bias. It is important for participants too to keep in mind that "my data are one part of the whole."
The future of citizen science: combining it with technology
Advances in technology, such as smartphone cameras and GPS, automatic species identification from images and environmental DNA, are widening the possibilities of citizen science. Even as technology advances, the people who "look, count and record" in the field remain important. Technology supplements human power; it does not replace it.
References and sources
- Ministry of the Environment, Biodiversity Center of Japan: Monitoring Sites 1000 – Long-term ecosystem surveys at about 1,000 sites nationwide (including the coastal survey)
- Ministry of the Environment: Publication of the Monitoring Sites 1000 coastal survey summary report, fiscal 2008–2012 – Five-year summary for rocky shores, tidal flats, eelgrass beds and seaweed beds
- Ministry of the Environment: Ikilog – A site to post and share observations of familiar wildlife
- JEAN (Japan Environmental Action Network) – Japan secretariat of the International Coastal Cleanup
- Ocean Conservancy – Reports of the International Coastal Cleanup
- Reef Check – Citizen-participation monitoring of coral reefs and seaweed beds
- Papp and Oremus (2025) Plastic bag bans and fees reduce harmful bag litter on shorelines – Published in Science. Evaluation of policy effects using citizen science data
- GBIF (Global Biodiversity Information Facility) – Open platform for worldwide biodiversity observation data
* Listed in order of reliability: government agencies and academic institutions > peer-reviewed papers > specialist organizations > reliable media